Below is an example of how using Modeloptic's table structure helps you produce superior models versus an equivalent model built in Excel.
Modeloptic's Table Structure: Comparison Against Excel


Luke Harris
Co-Founder, Modeloptic
Example Forecast in Excel
Let's say your company manufactures and sells a physical product. In Excel, you'd do something like this:
- Add a line for # of Units Sold
- Add a line for Price / Unit Sold
- Add a line for Product Revenue, multiplying the two above
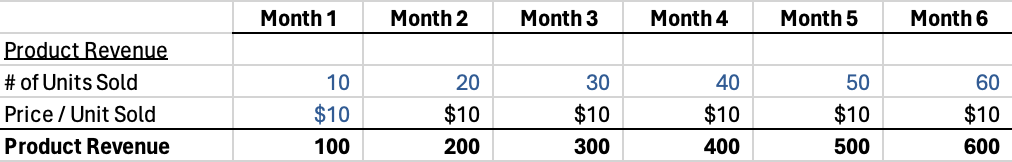
Pretty straightforward, can't really simplify that. (In Modeloptic, if you're doing something this simple, you can do this using a free-form table).
Now let's say you add another product. Several changes are now required:
- Each product now needs a label (since there's not just one anymore)
- The build we made needs to be duplicated, and assumptions need to be updated for the new product
- We need to add new tables that sum up units sold and product revenue
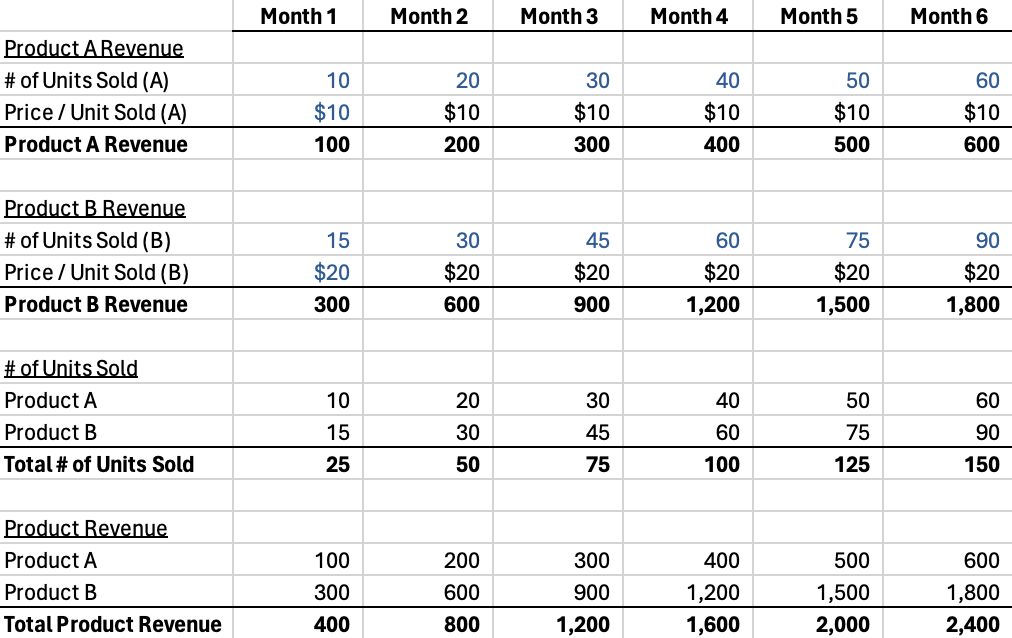
With only one additional product, things have already gotten much more complex.
However, there's still more to consider:
- Products have different manufacturing costs, margins, production schedules, inventory levels, etc., so before we're finished, there's more to be done for each of these products
- We'll also need summary views & analysis: # of Units Sold by Type, maybe the % of total Revenue by Product Type, Gross Profit by Product, etc.
Now if we add another product, we'll need to make changes all over the model:
- New # of units sold, pricing, and revenue calculations
- Add the new product to all of the summary views and analysis tables, making sure that you don't miss including the new product in any of the total formulas
- Add the new product to every component of CoGS and margin calculations
- Feed the updated revenue and CoGS calculations into the income statement
- Create a new inventory build for the product and feed it into the balance sheet
- Feed in historical data metrics for the new product
- Add the new product to your reporting materials...
That's a lot of complexity to manage.
Example Forecast in Modeloptic
This is an example of a situation where Modeloptic shines.
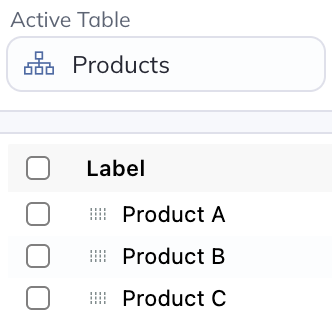
First, make a table where you list which products you sell:
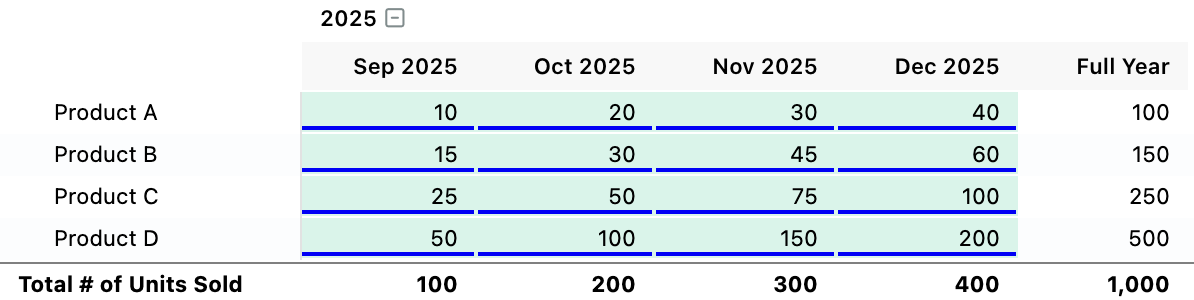
Add a table for # of Units Sold:
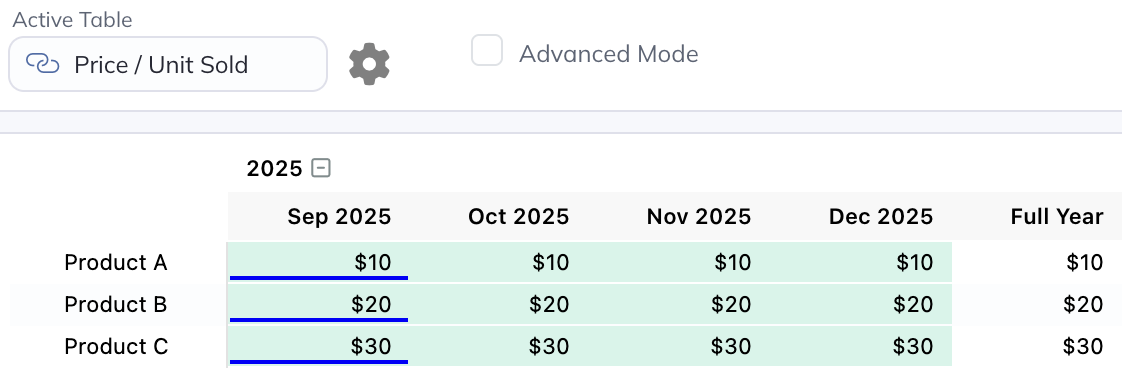
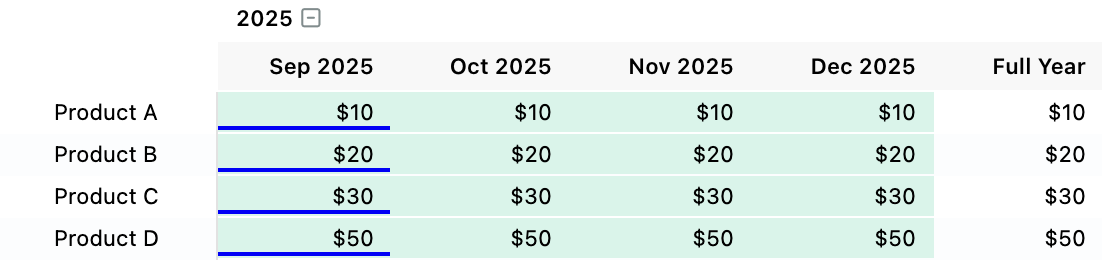
One for Price / Unit Sold:
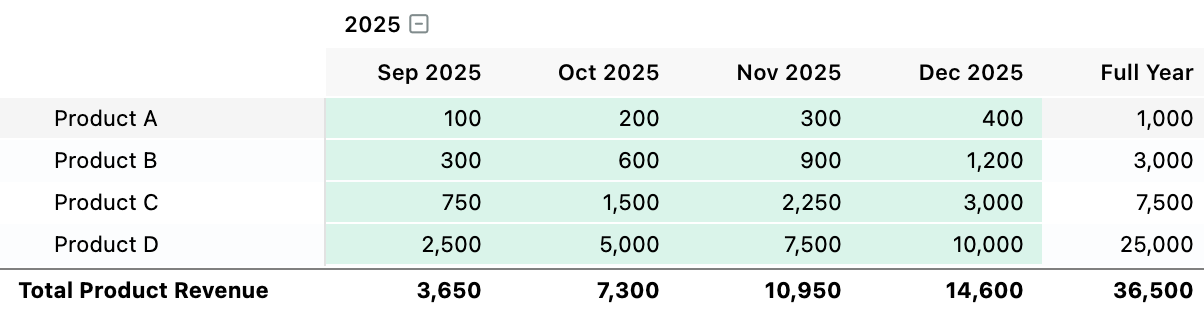
And one for Revenue / Product:
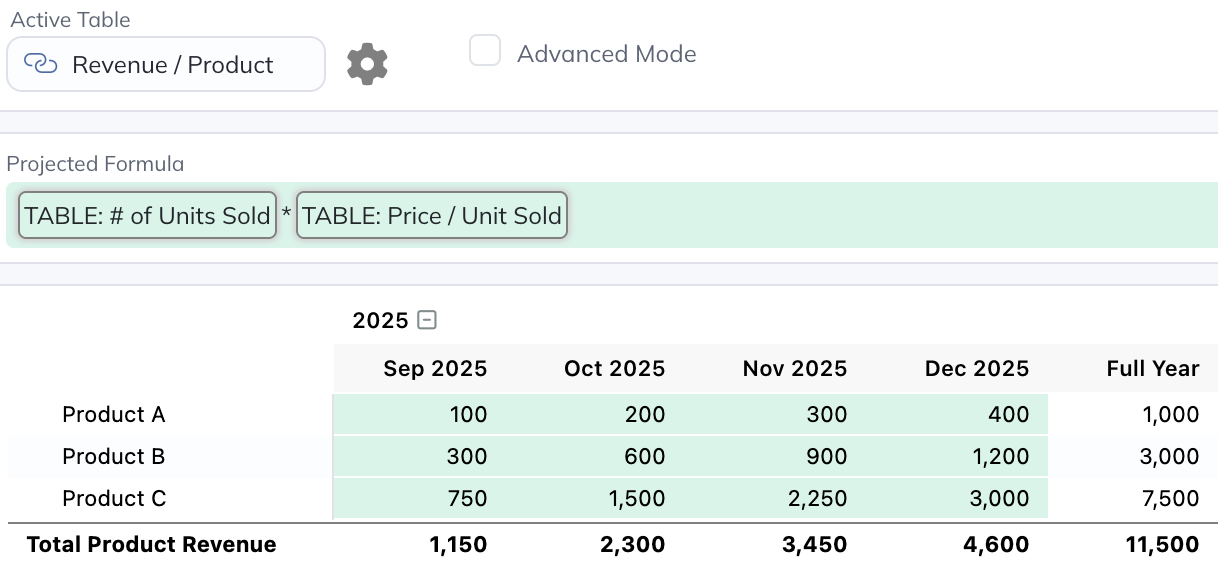
The "# of Units Sold" and "Price / Unit Sold" tables both contain hardcode inputs for each product (like in the Excel example), but the "Revenue / Product" table only needs a single table-level formula to multiply the # units sold table * the price / unit table to get revenue / product:

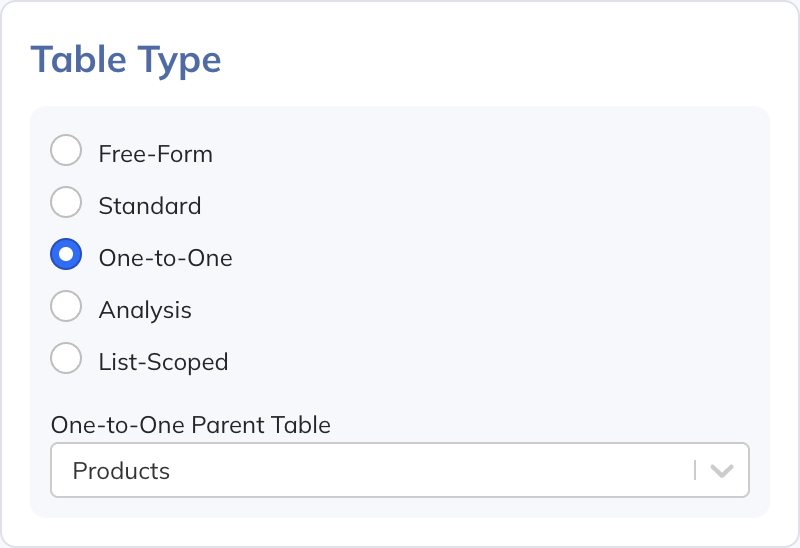
All of these tables are defined as "One-to-One" tables that reference the products table, meaning that each product has a corresponding row in each of these tables:
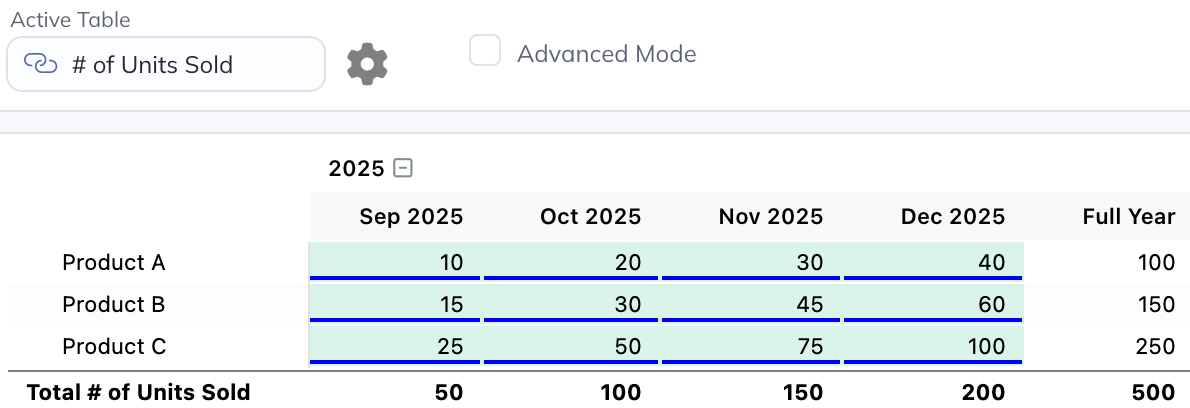
Any time you add a new product, it's automatically added to every relevant table. We just add it to the parent table:
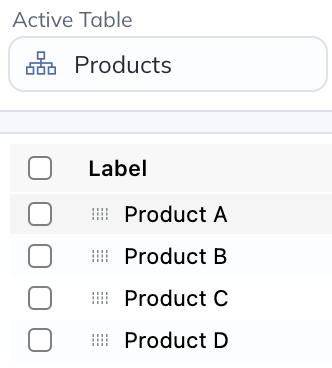
And then Modeloptic does the rest for you. Here's # of Units Sold that includes the new product:
Here's Price / Unit Sold:
And here's Revenue / Product:
Using Analysis Tables
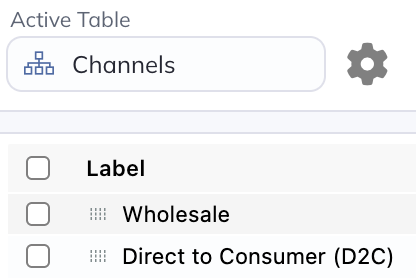
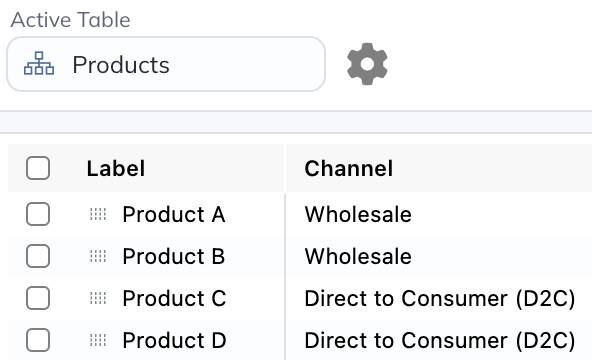
Now let's say you want to group these products based on what channel they're sold through. First, we'll create a table for the channels:
Then we'll add a List type custom column on the Products table (the one where we defined what products the company sells) and assign each to a channel:
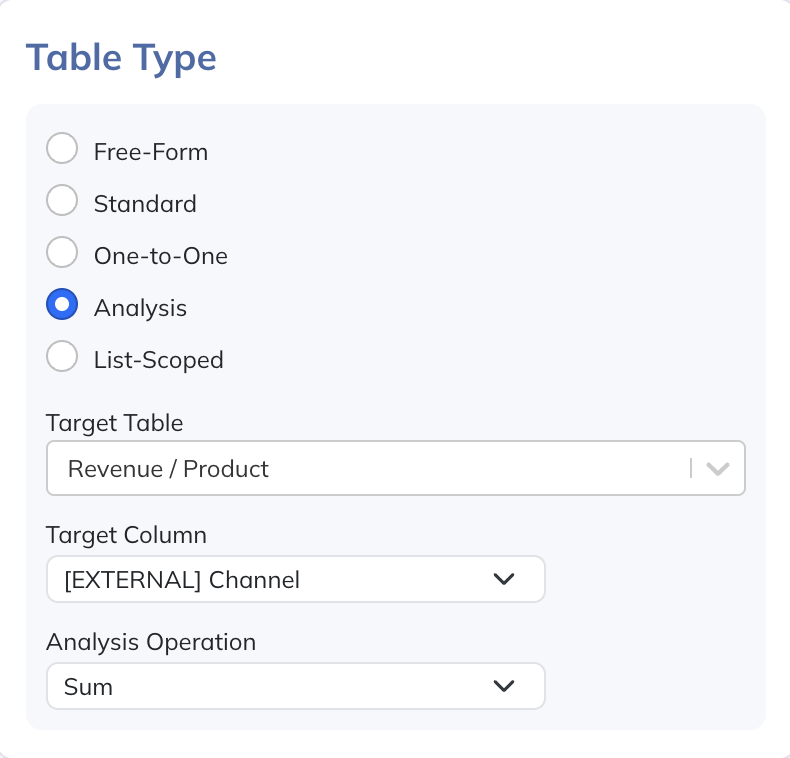
We already have a Revenue / Product table, so we can easily see Revenue / Channel by creating an Analysis Table. We then reference the Revenue / Product table, select that we want to see an aggregation by Channel, and Modeloptic creates it for us.
Here's what the Analysis Table Settings look like to do that:
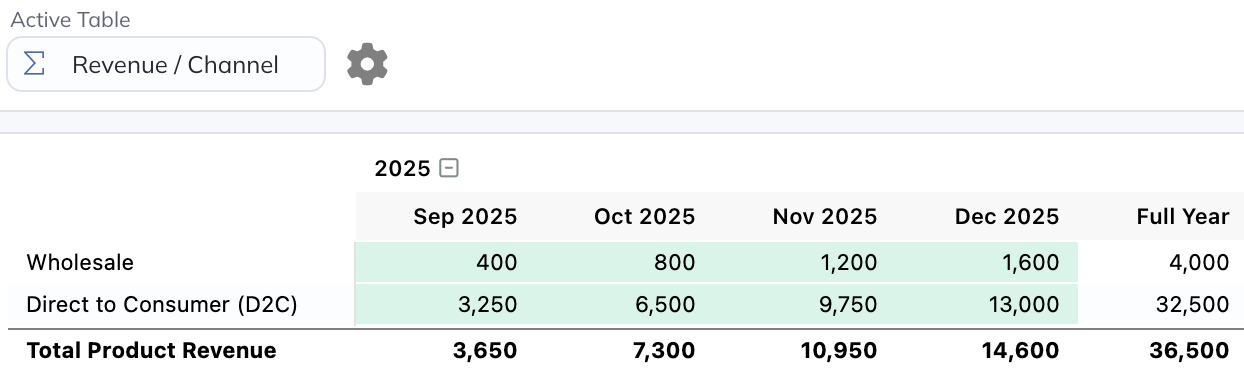
And here's what the resulting Revenue / Channel table looks like:
Rounding Out the Forecast
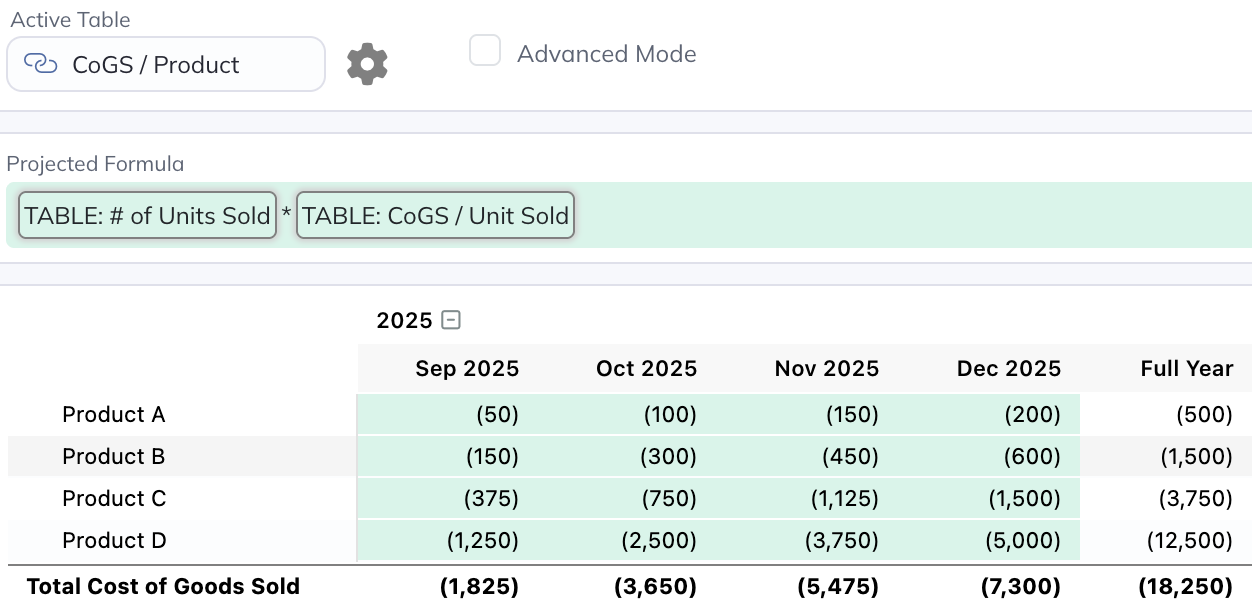
Since everything is already set up to forecast per product, we can easily add in additional pieces of the forecast. Here's CoGS / Unit Sold:
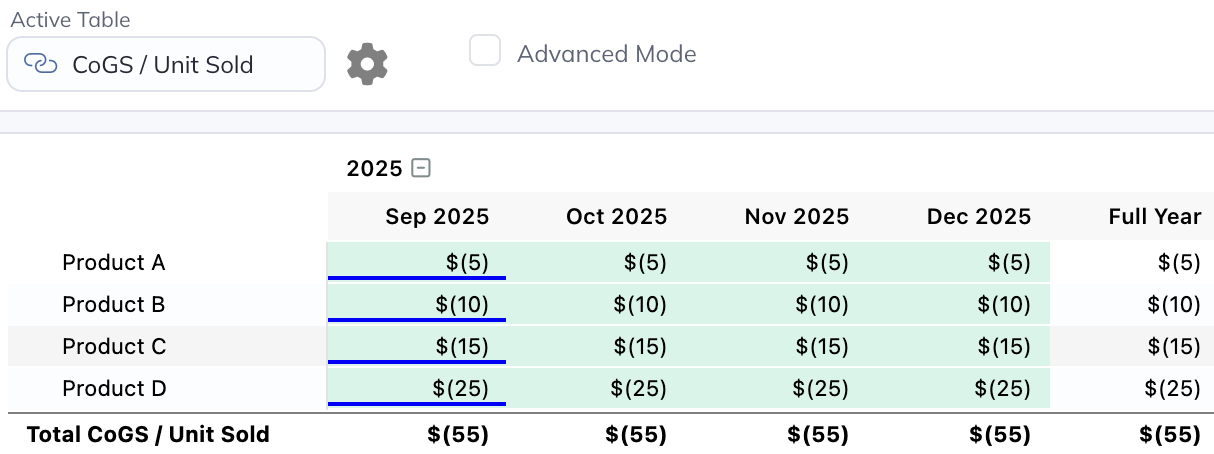
We already have # of Units Sold / Product, so we can just use a single table-level formula to multiply the # Units Sold table * the CoGS / Unit Sold table to get CoGS / Product:
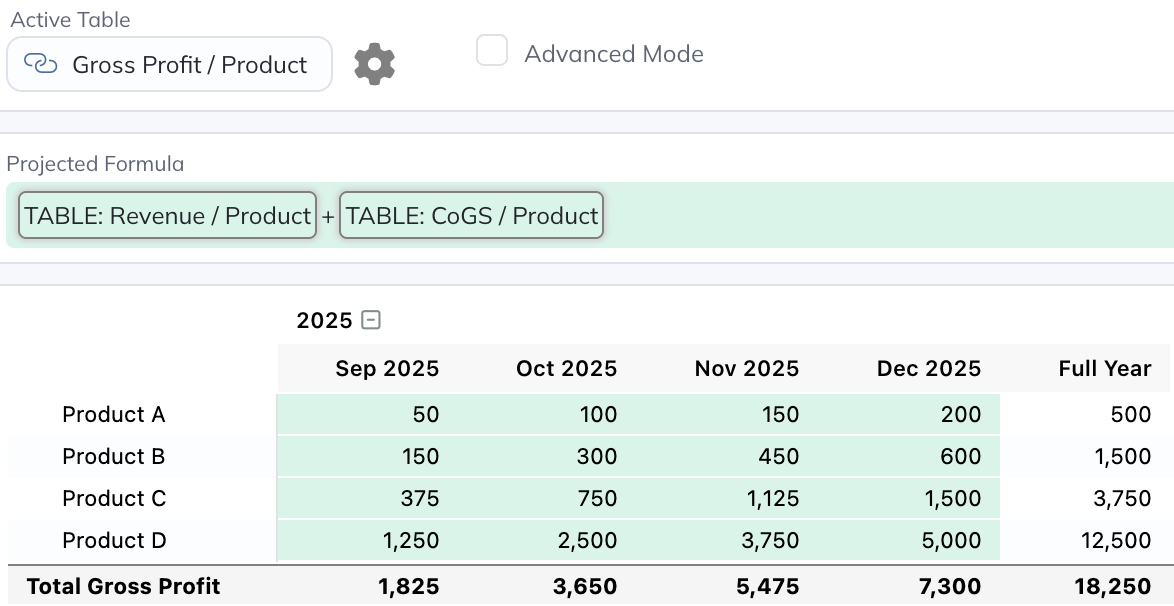
With one more table-level formula, we can get Gross Profit / Product:
And we can continue on to easily add other relevant calculations like inventory balances and so on.
Creating a Summary Table
Then you can put together a summary table that pulls together some of the most important metrics:
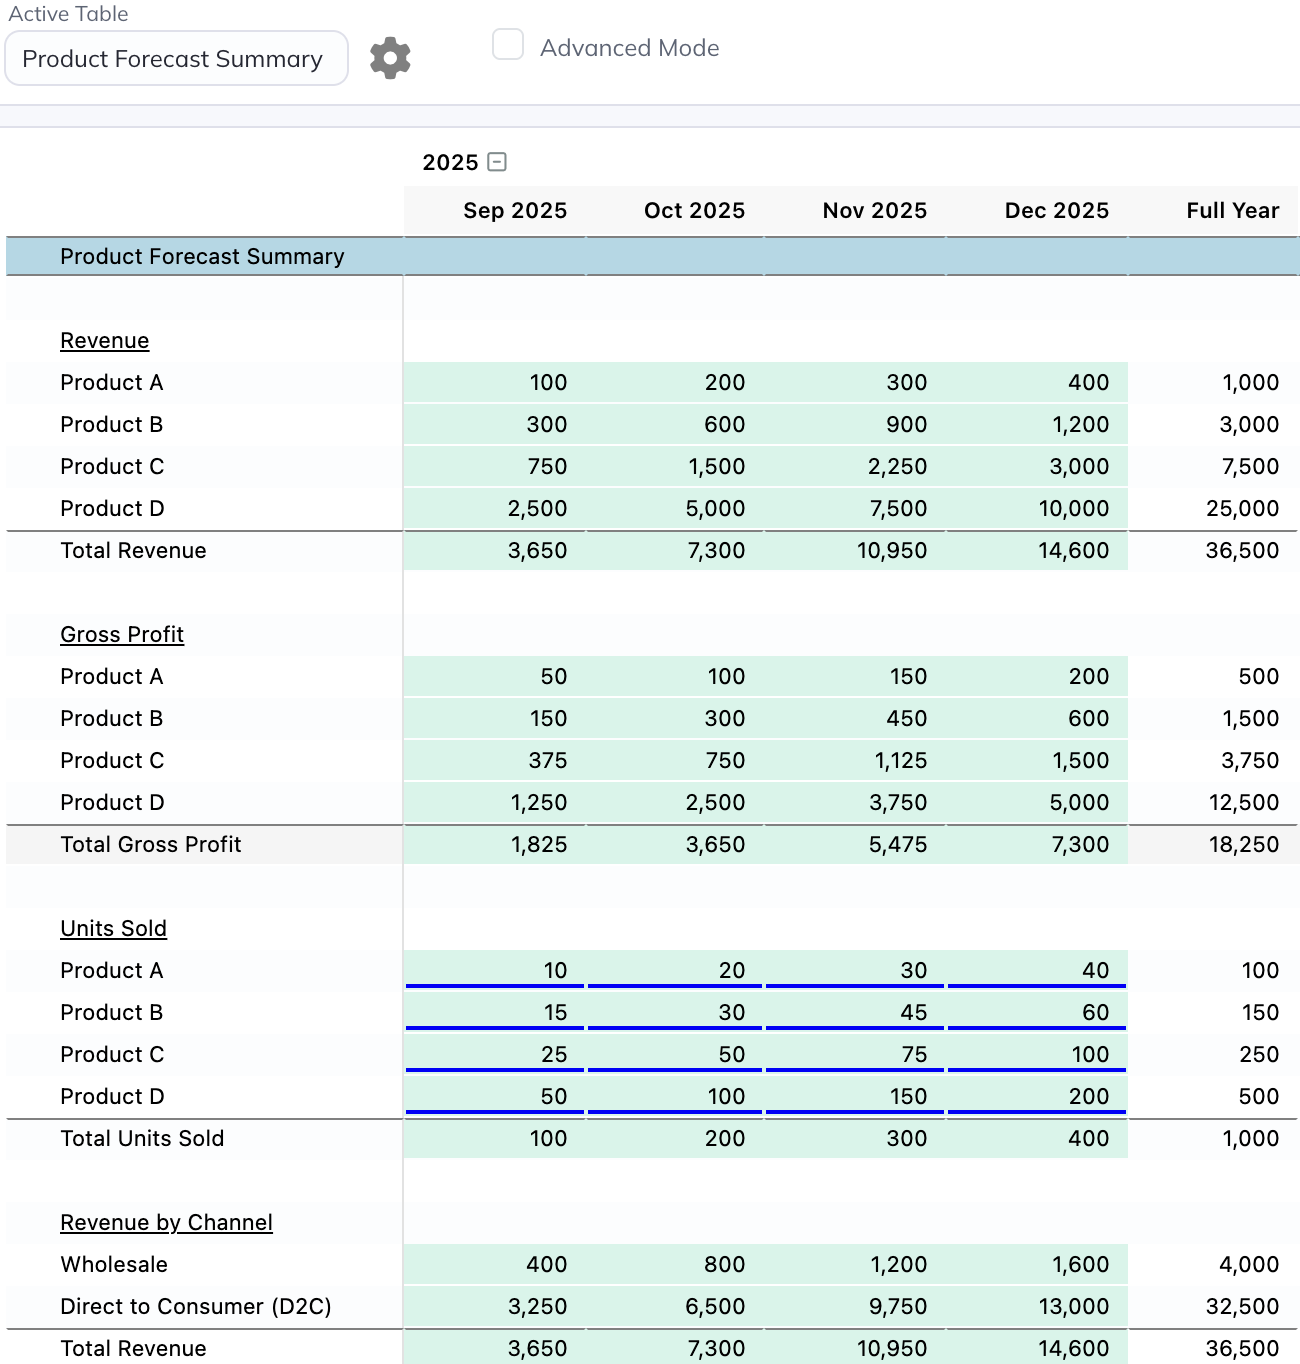
This is done by creating a free-form table and using a few of the tables we created previously as sub-tables within it:
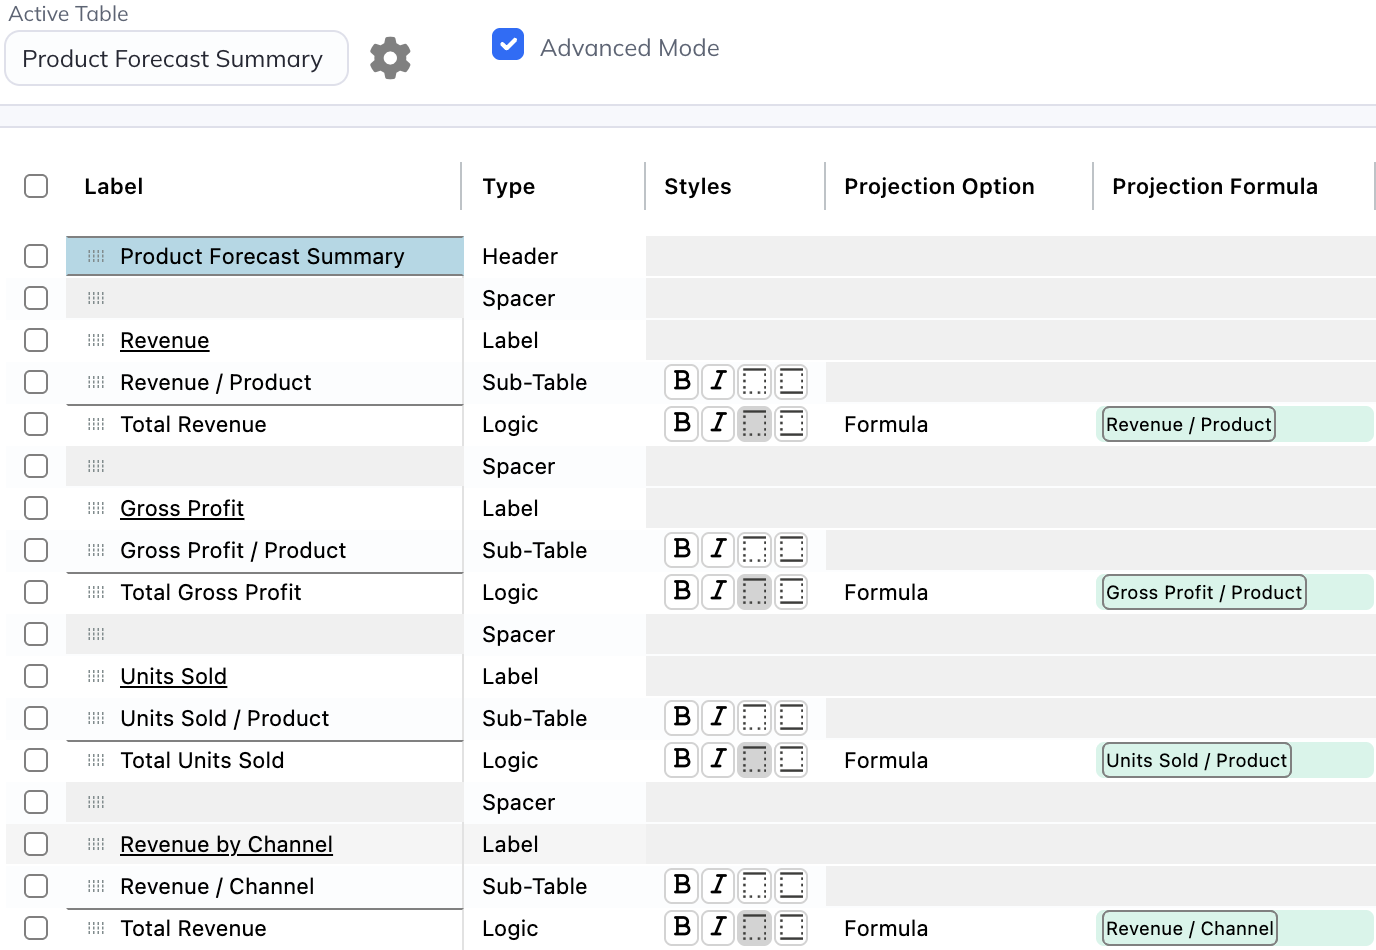
Since we're using other tables as sub-tables here, this summary view will automatically update when the underlying tables change.
See One Product at a Time
Modeloptic has a unique feature called a "List-Scoped" table that lets you see the detail for any individual entry (or Product in this case) in isolation:
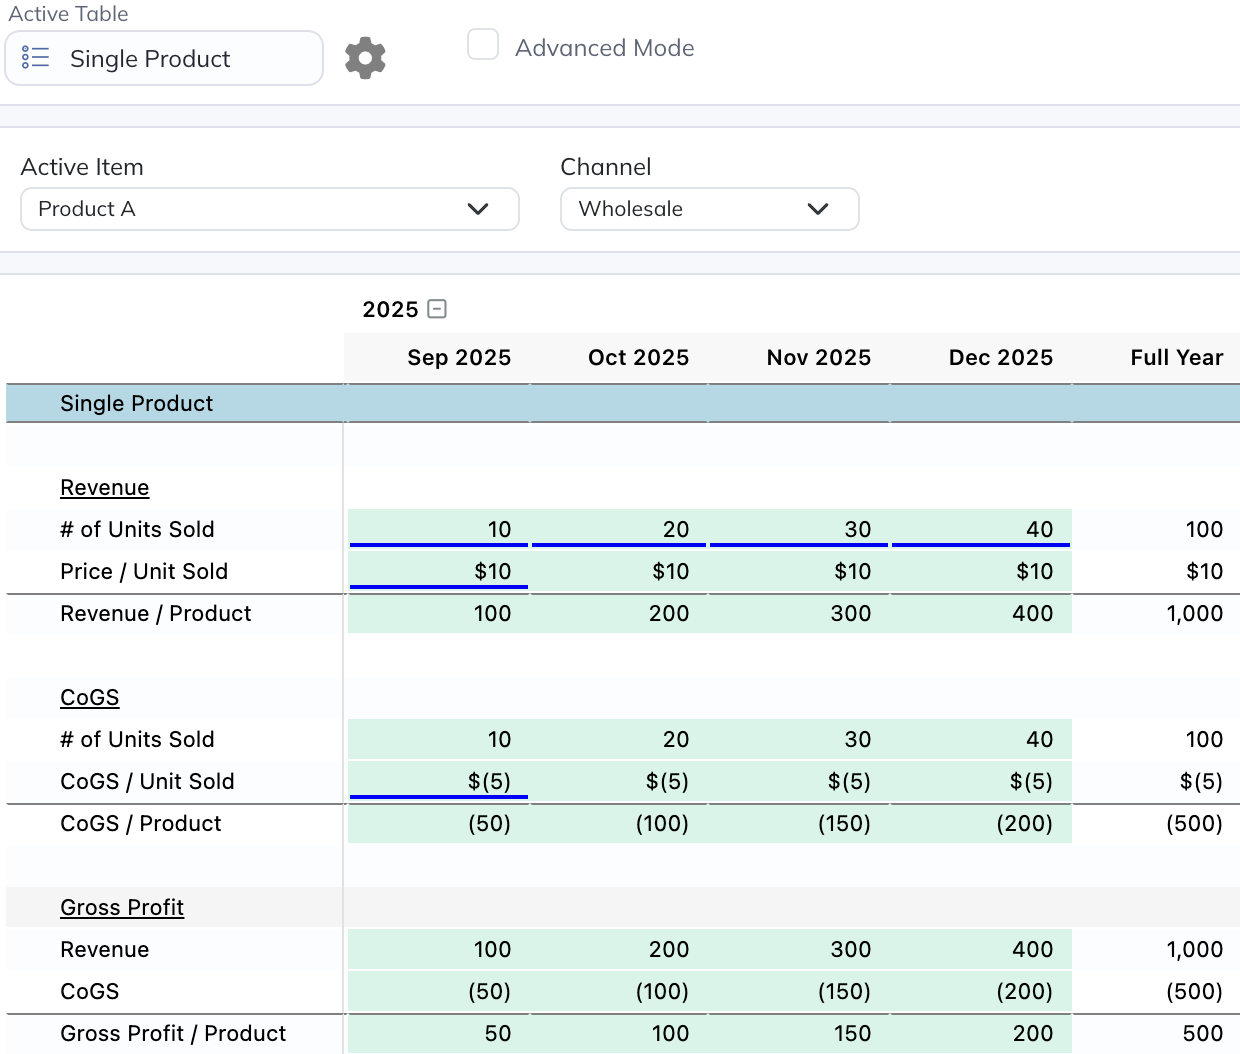
All of the rows you see in this view are pulled from the relevant component tables we created above, and are editable here as well.
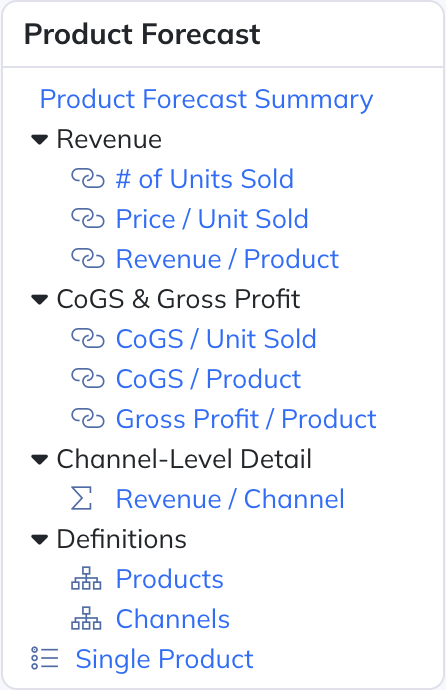
Organizing & Navigating Between Tables
We can organize all of the tables we've created into groupings for easy navigation between them:
Summary
As any seasoned financial modeler will recognize, managing all of this complexity quickly becomes very difficult, time-consuming, and error-prone in Excel. For anything beyond a very simple company model, Modeloptic is an essential tool to help you create much more powerful models and manage their complexity with ease.
There are additional benefits to using Modeloptic for such a forecast as well (managing historical data, building and updating reporting materials, managing user permissions, etc.), but we'll save that for another time.
If you're interested in learning more, please feel free to contact us, or take a look through our documentation.
Don't miss any updates
Join us to receive the latest news, articles, and updates from Modeloptic.
The Future of Finance
Ready to try out Modeloptic for your company?
Powerful and Intuitive Financial Reporting and Projections
© 2025 Modeloptic, LLC. All Rights Reserved.
The Future of Finance
Ready to try out Modeloptic for your company?
Powerful and Intuitive Financial Reporting and Projections
© 2025 Modeloptic, LLC. All Rights Reserved.