Features of Modeloptic
Take a tour of the product's extensive capabilities.
Features of Modeloptic
Take a tour of the product's extensive capabilities.
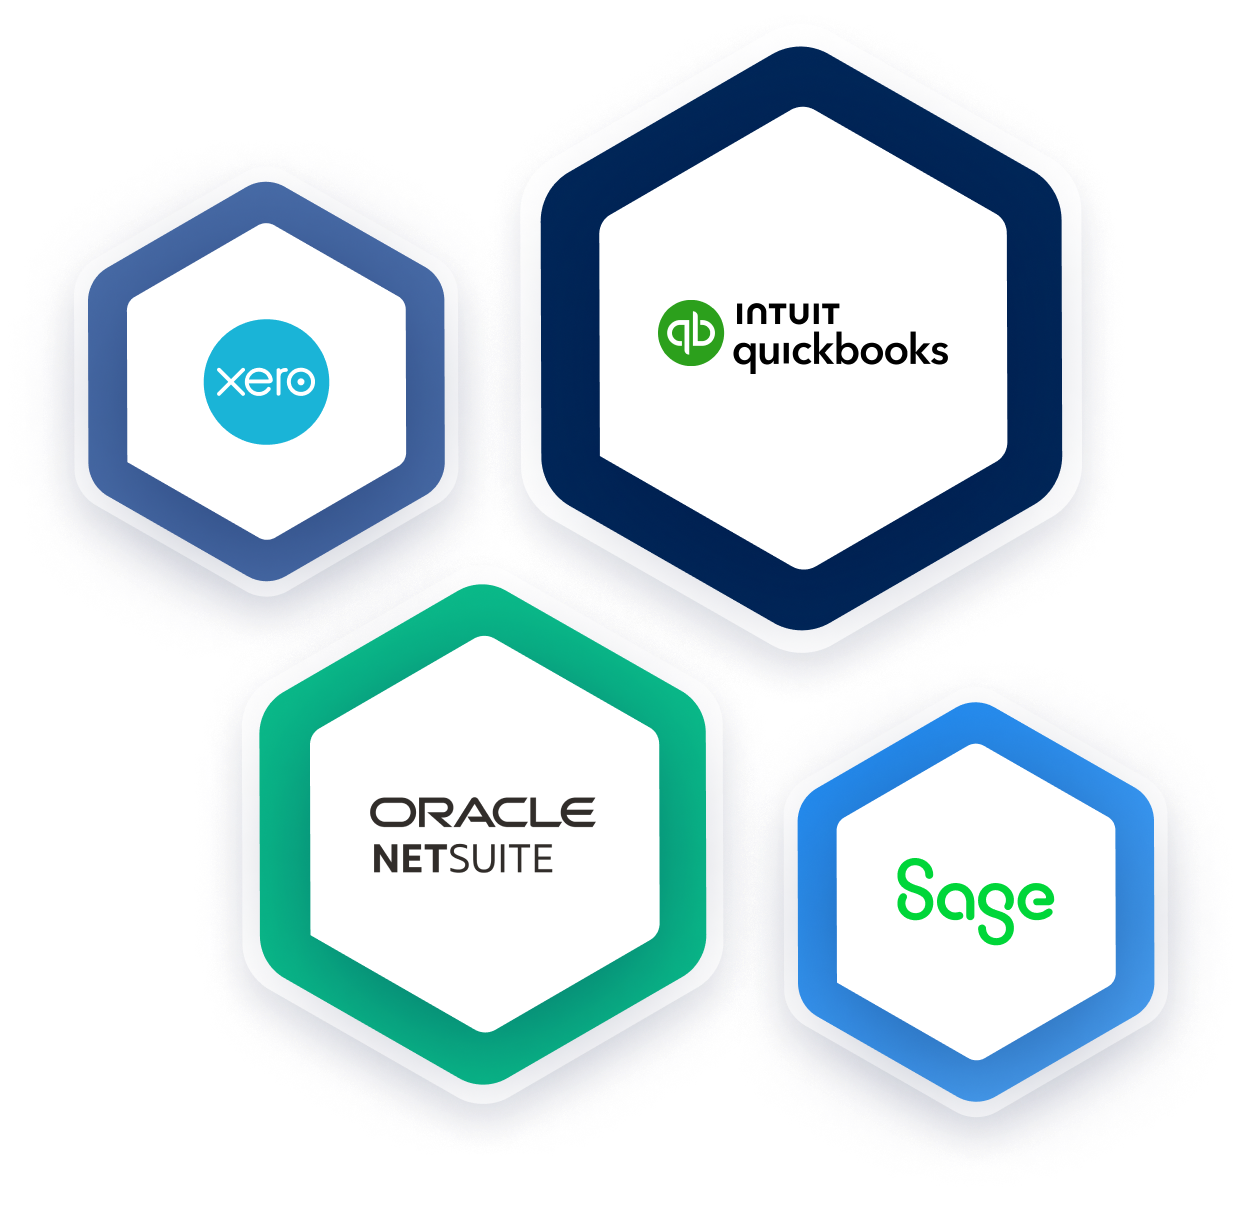
Accounting Integration
Modeloptic pulls your historical financials directly from your accounting system. This enables you to:
Effortlessly update your financials in Modeloptic each month, removing human error from the equation.
Map your detailed chart of accounts in the accounting system to your higher-level forecasting and reporting schema.
Dig into transaction-level detail when reviewing your financials without having to switch systems.
Build your projections in the context of connected historical data to ensure they are in alignment with actuals.
Easily update your projections and reporting package each month with the latest actuals.
Forecast Your Company's Future
Be rigorous about managing your business using Modeloptic's powerful and intuitive projection interface.
Automate away the tedious and error-prone steps in building and maintaining your financial model.
Choose from various pre-set forecast options to avoid building everything from scratch.
Take advantage of the system's guard rails to make sure your model stays accurate and free of structural errors.
Use the version control system to create as many projection sets as you'd like, including different scenarios, without fear of losing data.
Forecast Your Company's Future
Be rigorous about managing your business using Modeloptic's powerful and intuitive projection interface.
Automate away the tedious and error-prone steps in building and maintaining your financial model.
Choose from various pre-set forecast options to avoid building everything from scratch.
Take advantage of the systems's guard rails to make sure your model stays accurate and free of structural errors.
Use the version control system to create as many projection sets as you'd like, including different scenarios, without fear of losing data.
Flexible Level of Detail
Either keep your forecast high level (like forecasting line items with a simple growth rate or percentage of revenue assumption)...
...or project in granular detail, using whatever custom logic is needed to capture the dynamics of your business.
Flexible Level of Detail
Either keep your forecast high level (like forecasting line items with a simple growth rate or percentage of revenue assumption)...
...or project in granular detail, using whatever custom logic is needed to capture the dynamics of your business.
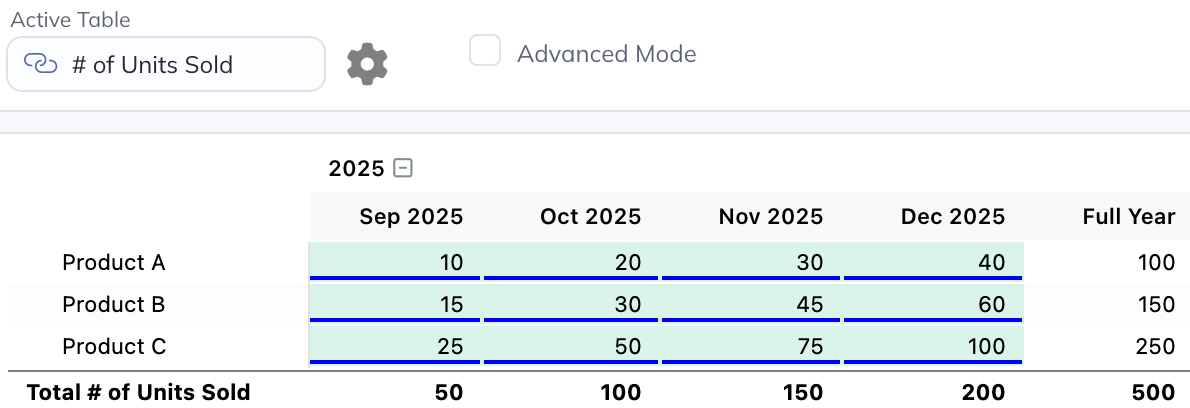
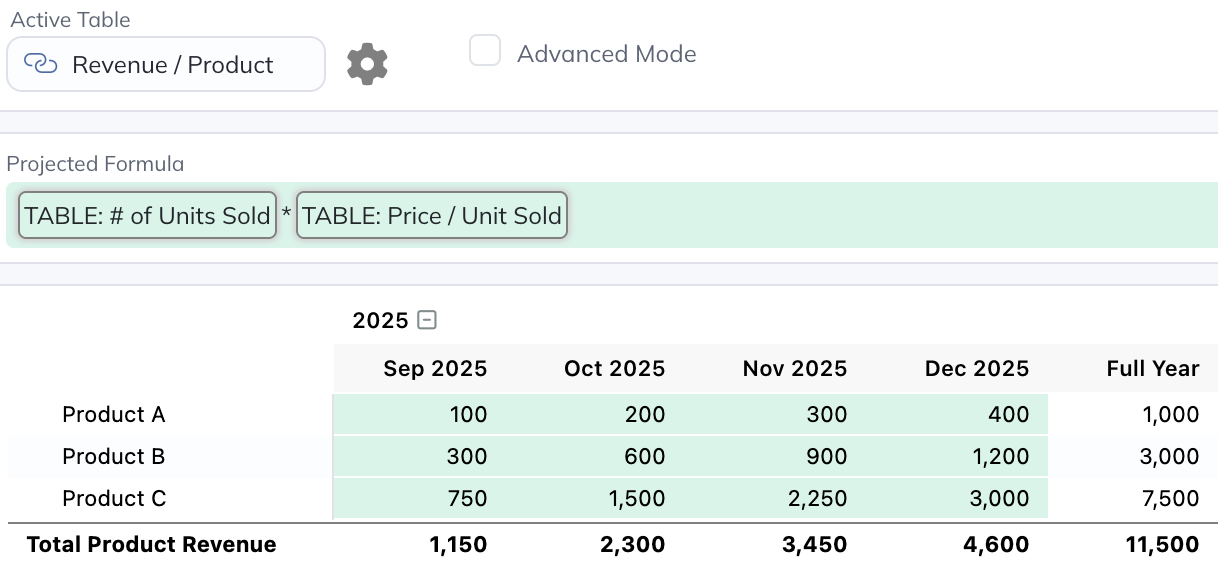
Powerful Forecasting Capabilities
Modeloptic has powerful and flexible forecasting capabilities that can handle both simple and complex forecasts.
Utilizes a table-centric structure for forecasting collections of similar items (like employees, customers, product SKUs, etc), and for operating on them as a group instead of as individual lines.
Create sets of related tables that share a similar structure and automatically stay in sync. When rows are added, deleted, reordered, or renamed in a parent table, the change is automatically reflected in all child One-to-One tables.
This allows you to forecast at a much higher level of abstraction than you'd be able to otherwise.
For simple forecasts, you can still use the free-form table type to add arbitrary rows and link them together however you want.
Easily link to these components from anywhere else in the model.
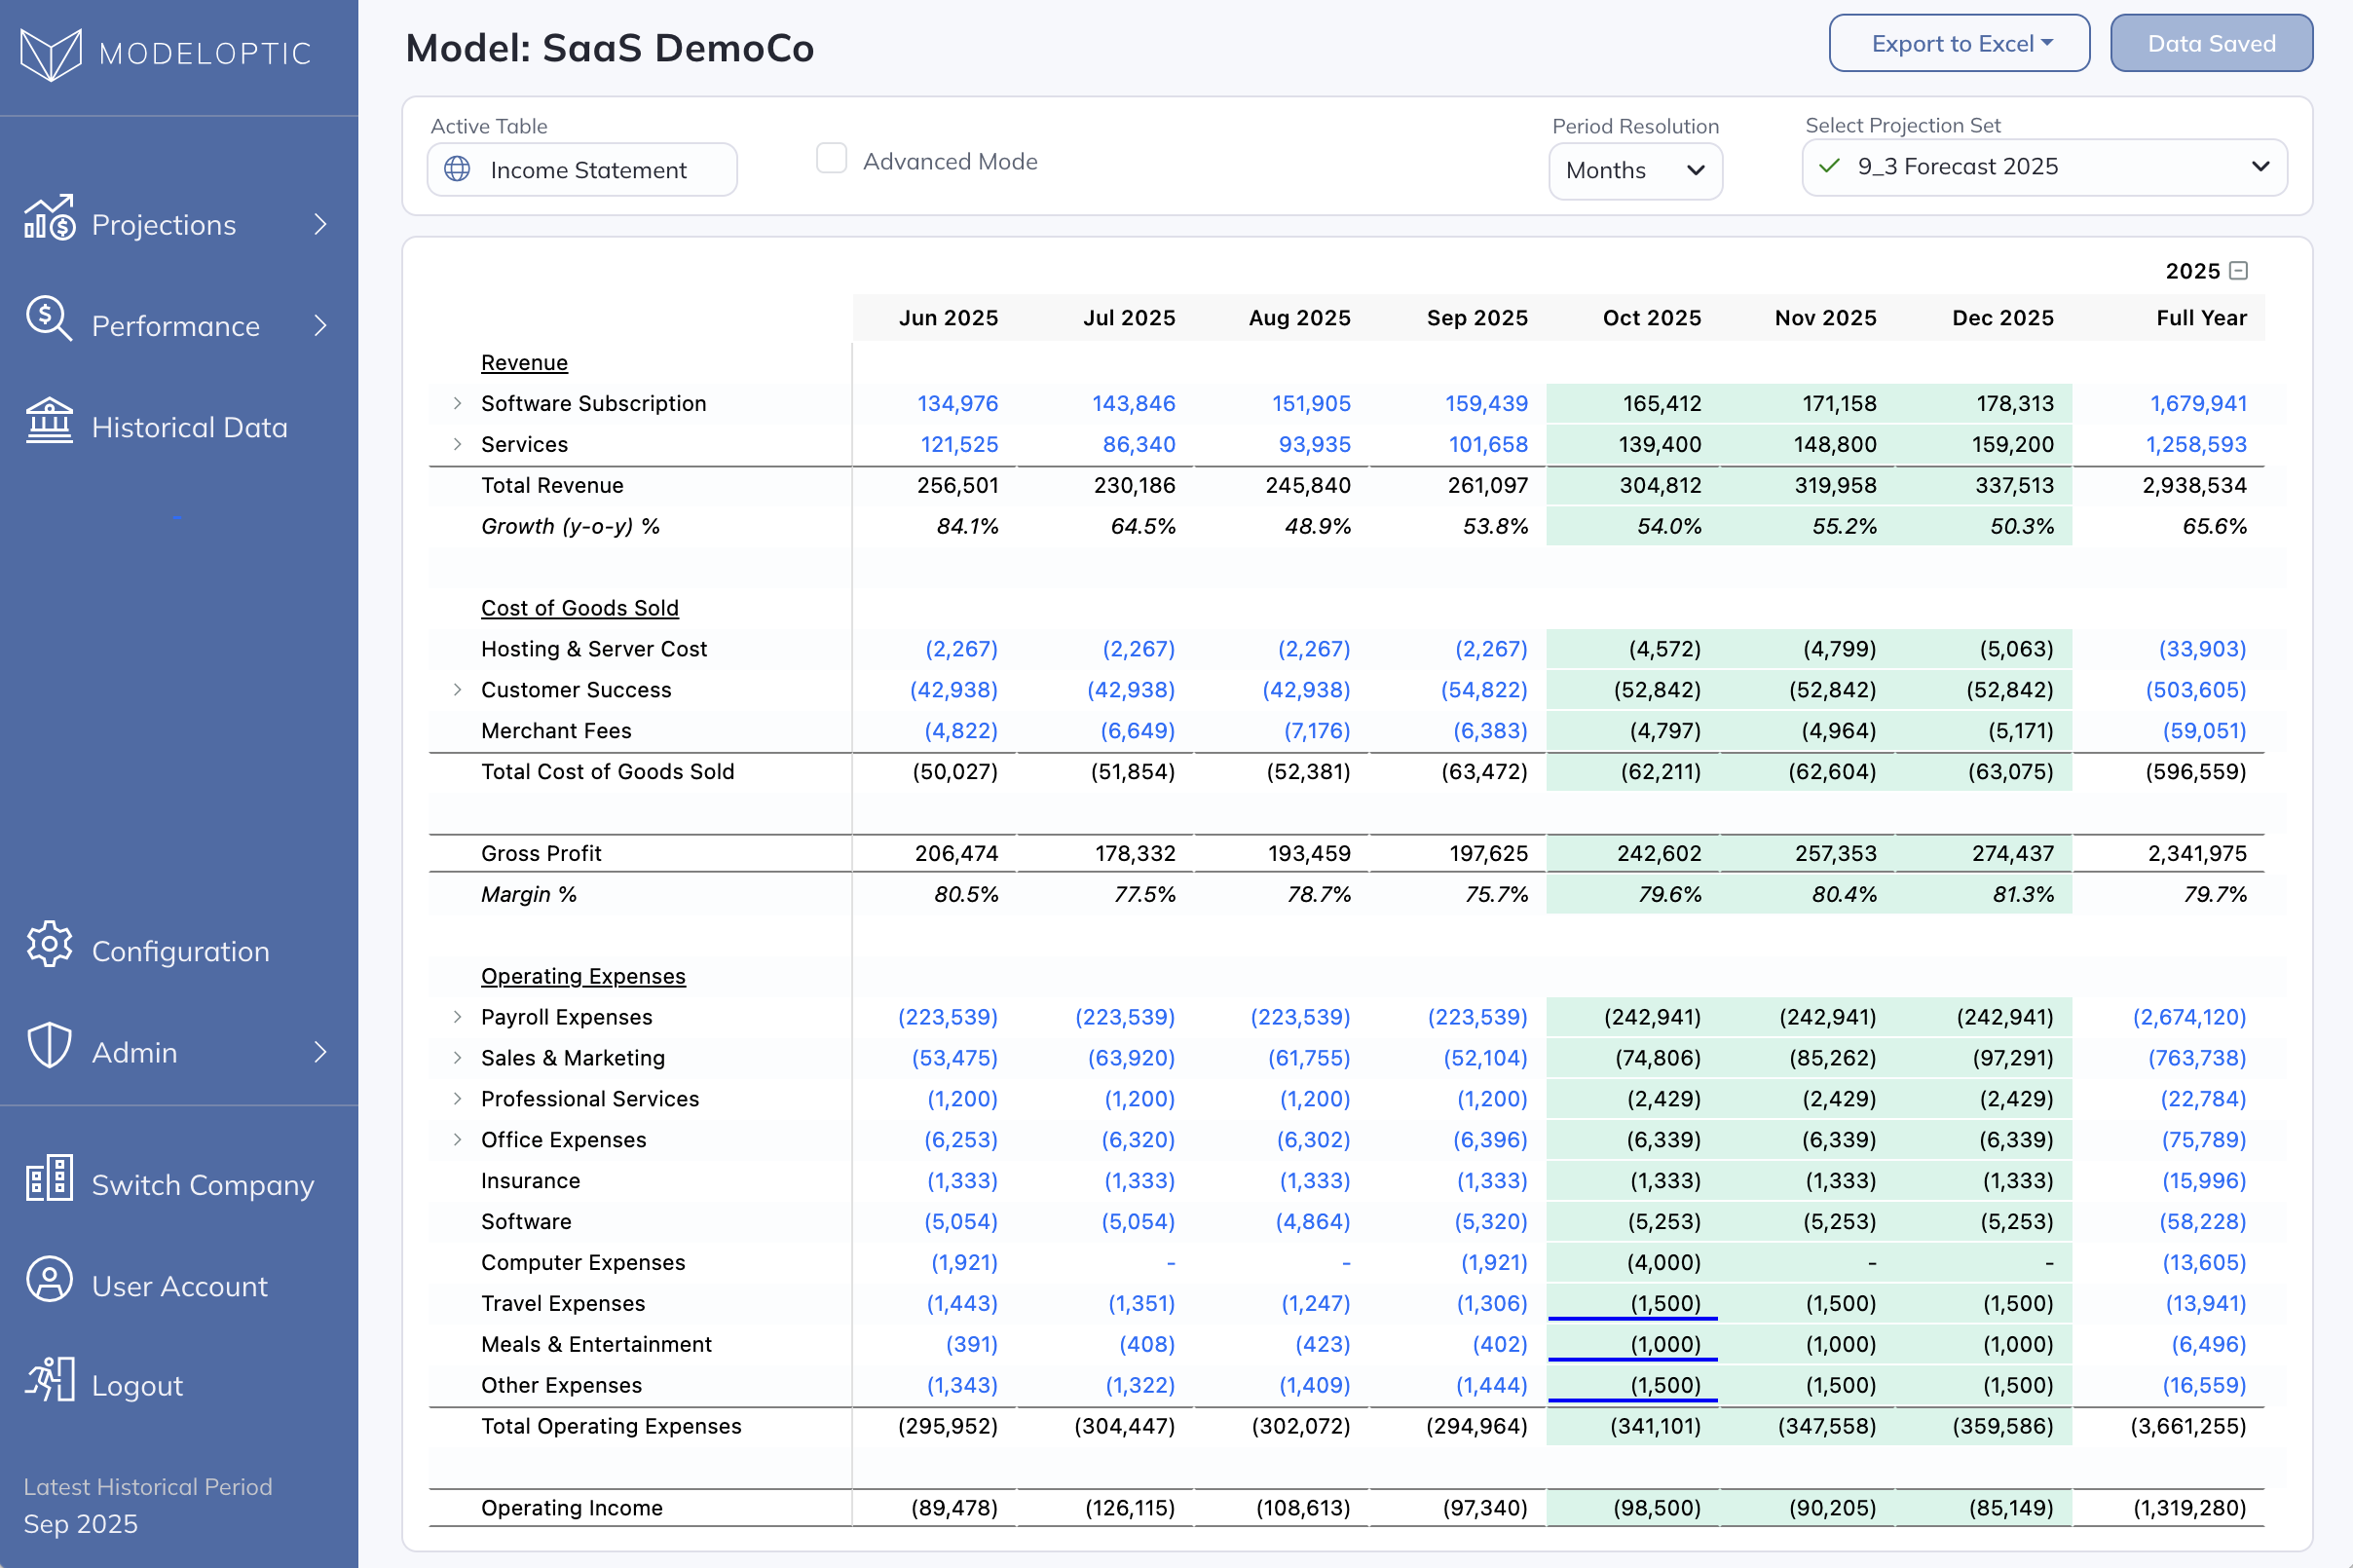
Build Full Three-Statement Forecasts
Modeloptic goes beyond forecasting a simple income statement, allowing you to forecast your Balance Sheet and Statement of Cash Flows to capture the important capital dynamics of your business.
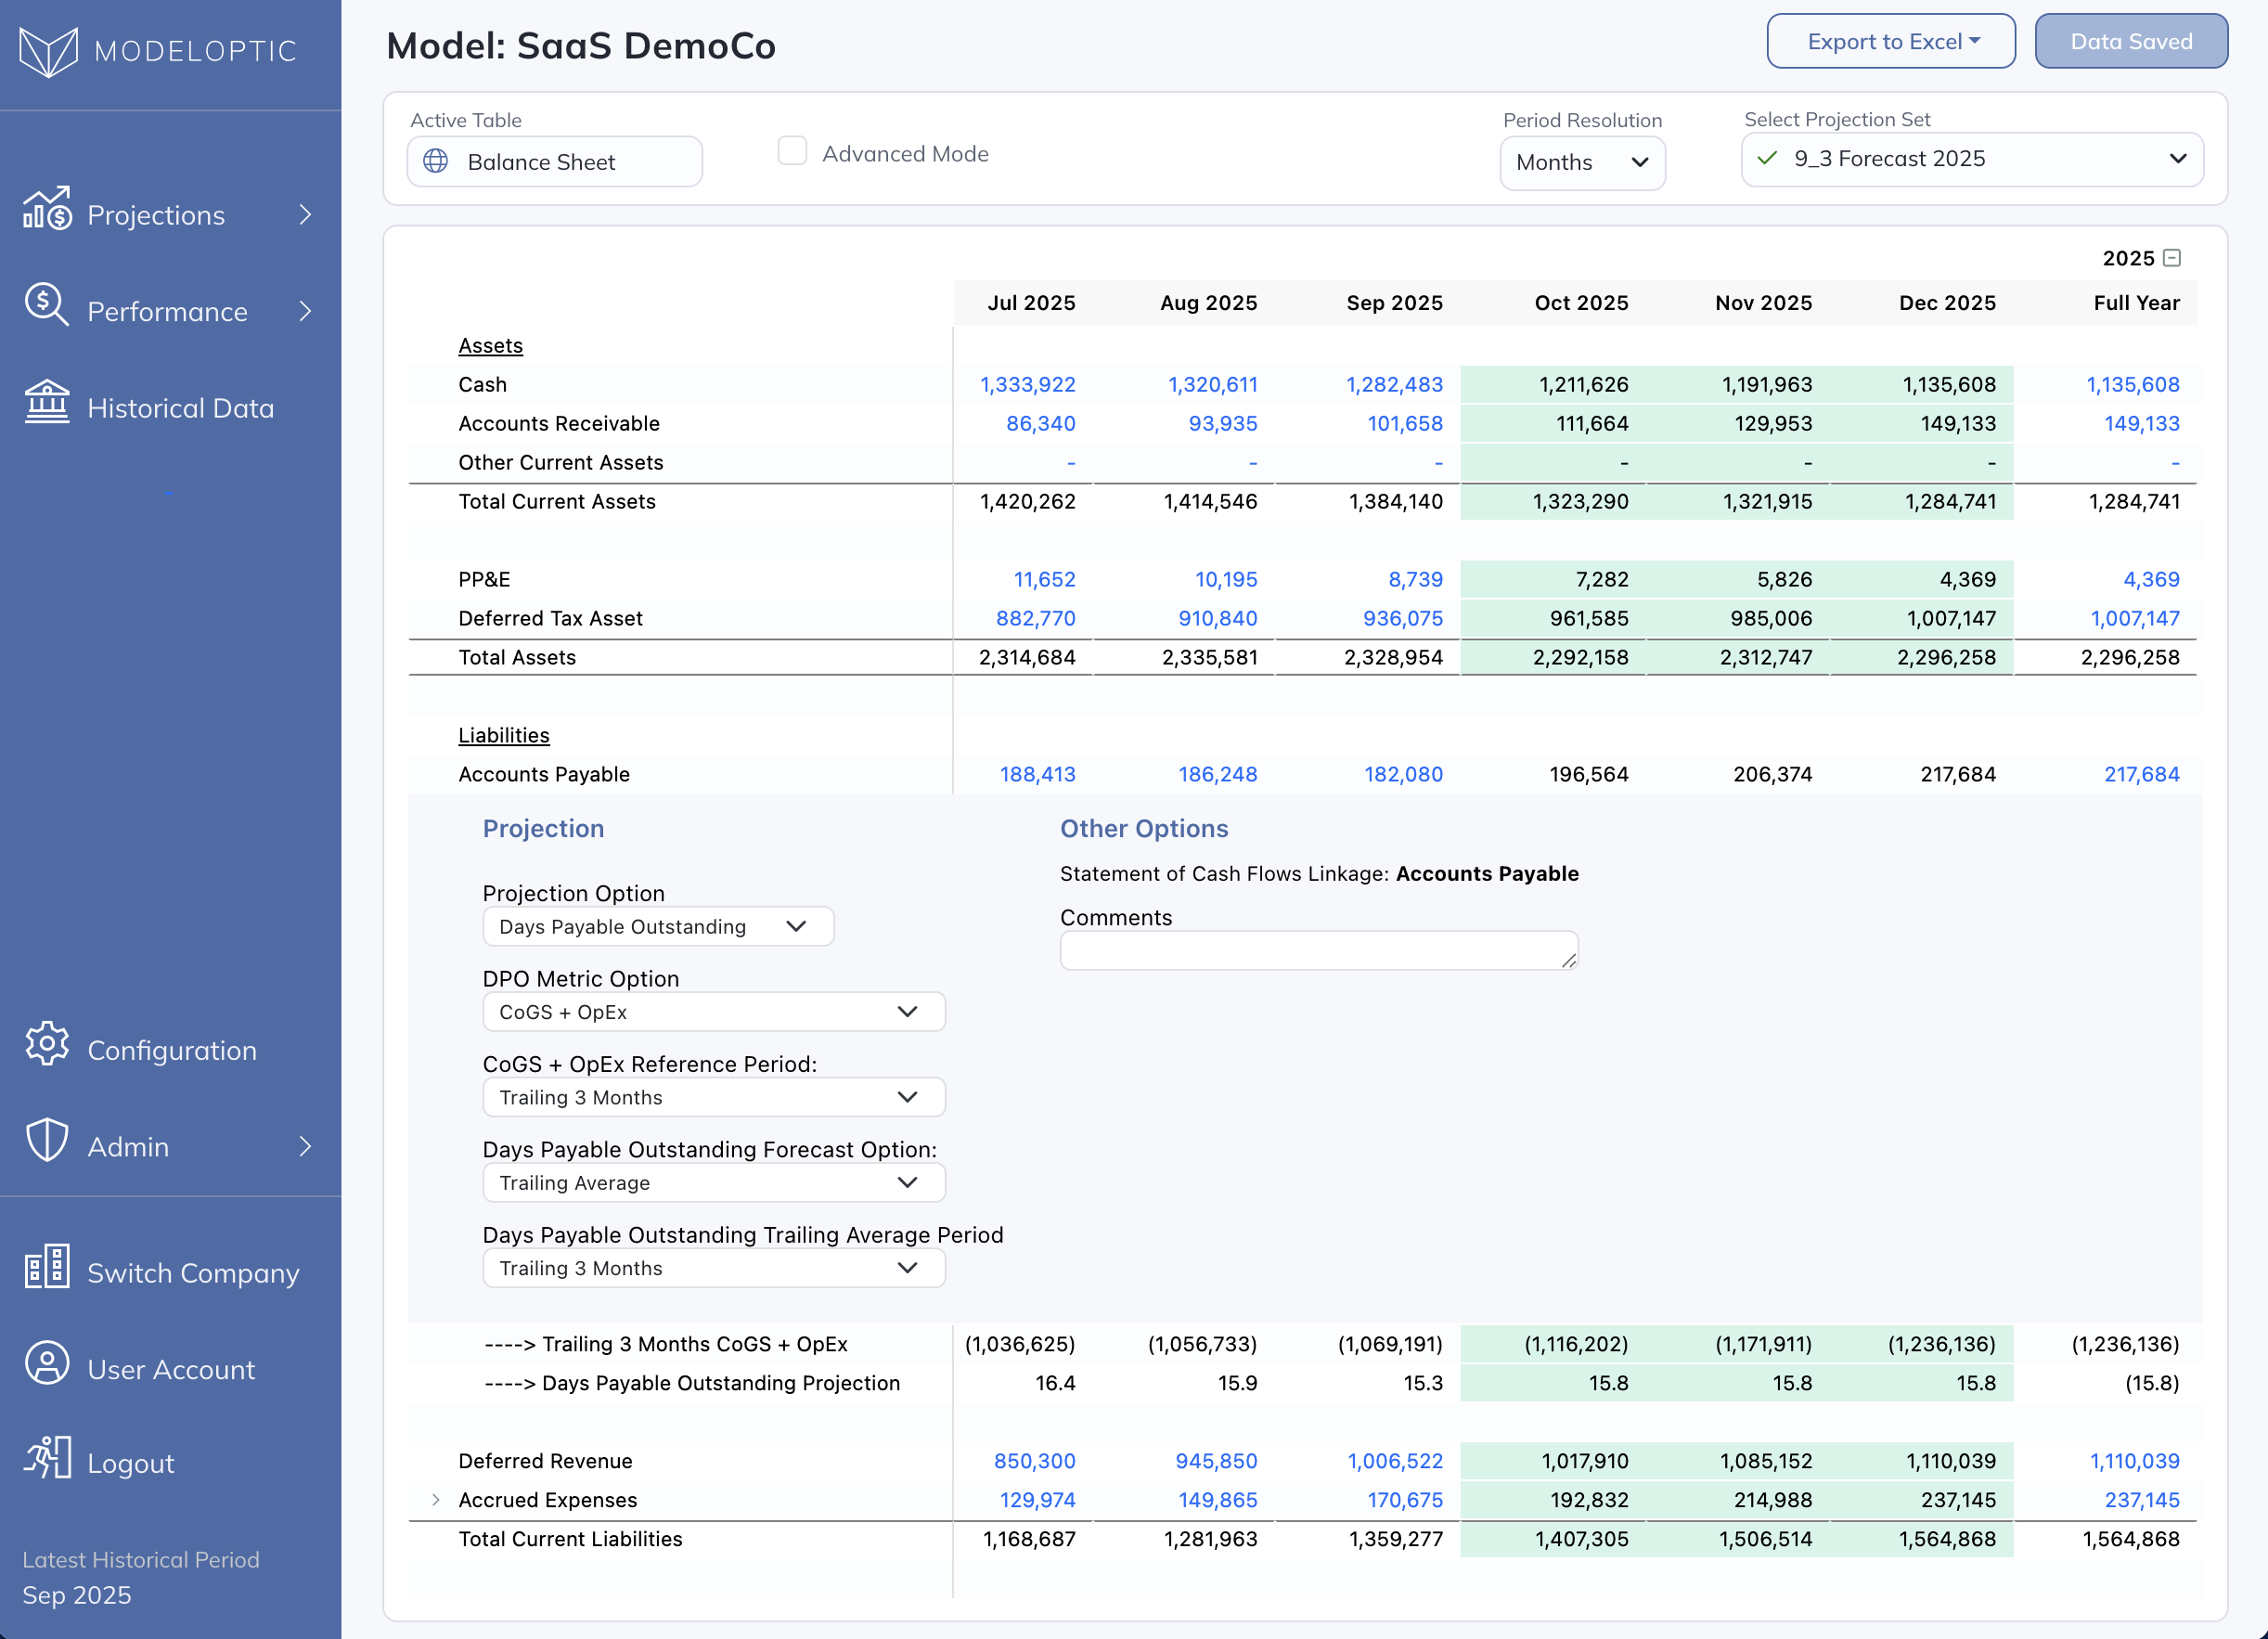
Build Full Three-Statement Forecasts
Modeloptic goes beyond forecasting a simple income statement, allowing you to forecast your Balance Sheet and Statement of Cash Flows to capture the important capital dynamics of your business.
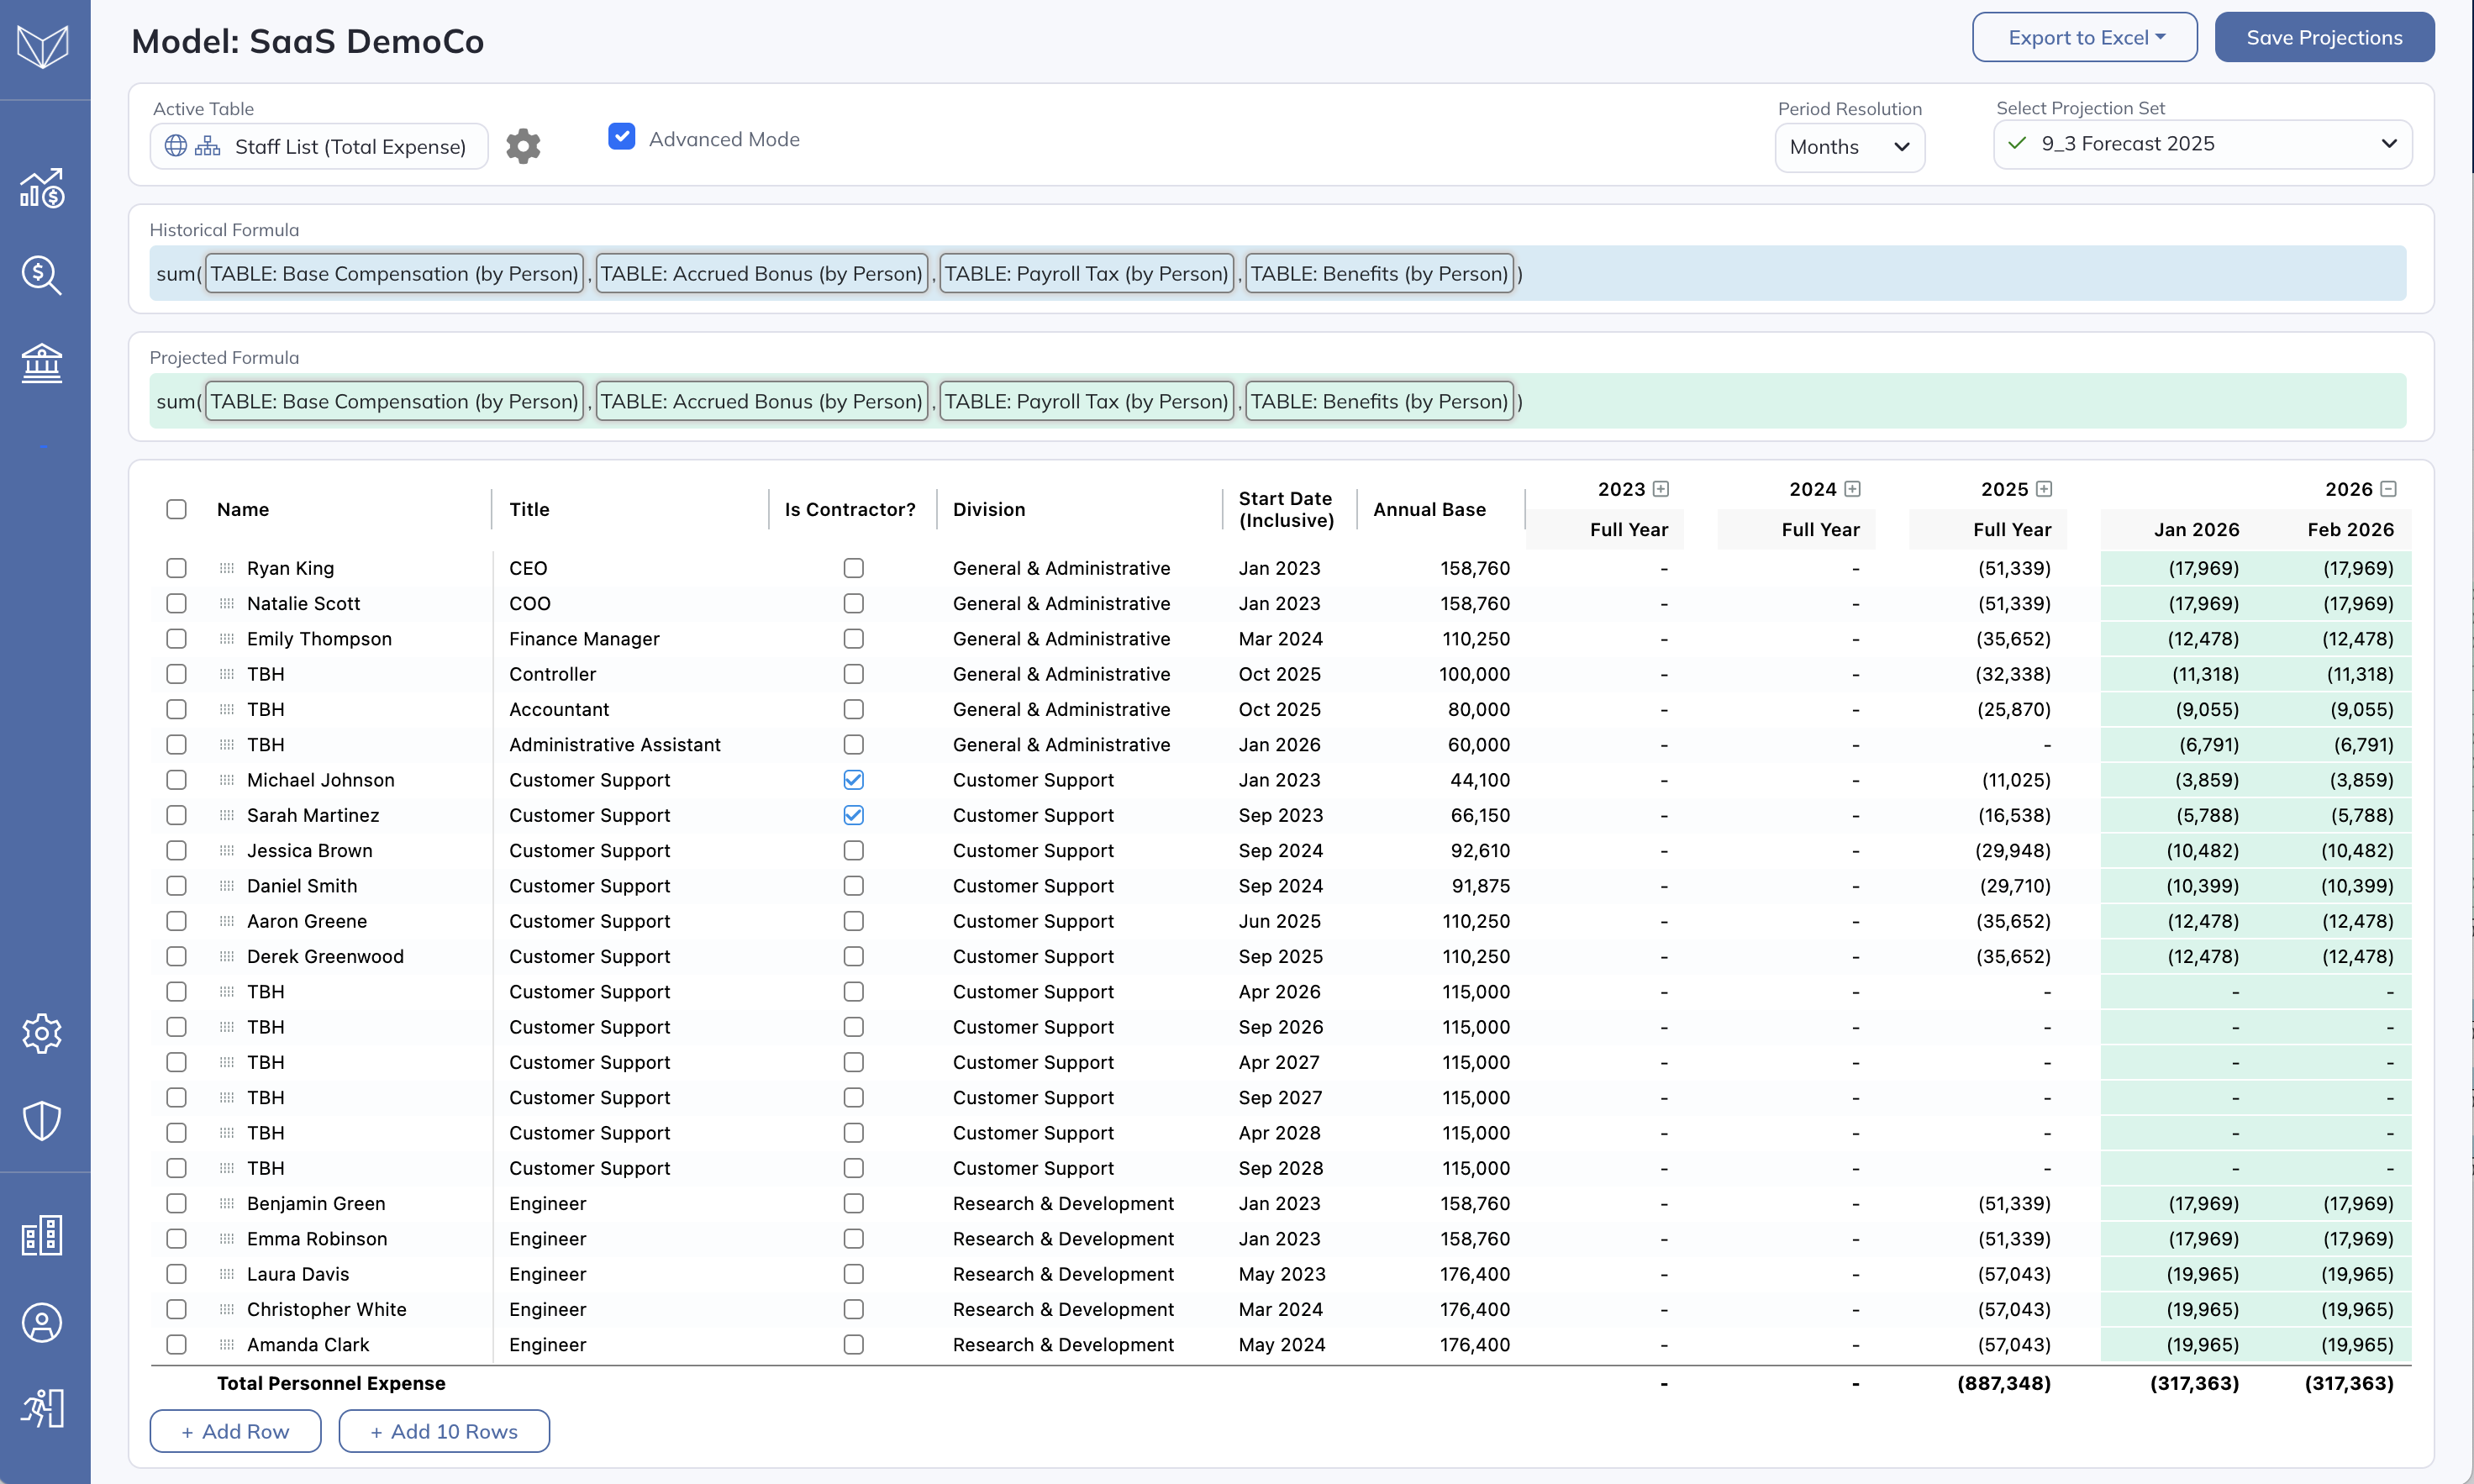
Forecast Personnel by Role
Forecast your existing roster and new hires in as much detail as you'd like.
Indicate whether a given person is a contractor or full-time employee to accurately forecast additional personnel expenses like payroll tax and benefits.
Optionally assign people to divisions, enabling you to forecast divisional expenses in granular detail and map them to their relevant cost centers.
Multi-Entity Capabilities
Subdivide your forecast into as many entities as you'd like, and Modeloptic will consolidate them all for you. Those entities can correspond to either separate companies / accounting instances, or to classes/categories representing departments or business units within a single company.
Manage user access and security at the user account level to provide the appropriate level of access to each user.
If you have entities that use multiple currencies, Modeloptic supports currency conversion between them and consolidation into a single functional currency.

Export Fully-Functional
Models to Excel
Models to Excel
Modeloptic can generate your model in Excel as if you had built it in Excel from the beginning.
Unlike other products, we recognize that Excel is still a key tool in the finance world, and Modeloptic is built accordingly.
Forecasting in Modeloptic combines the positive elements of Excel with the efficiencies of a purpose-built forecasting tool.
Key Operating Metrics
Load in your historical operating metrics (# of active subscribers, # of units sold, etc) to utilize them as drivers of your forecasts.
Create a summary of key metrics to add critical context to your financials and tell the full story of the business.
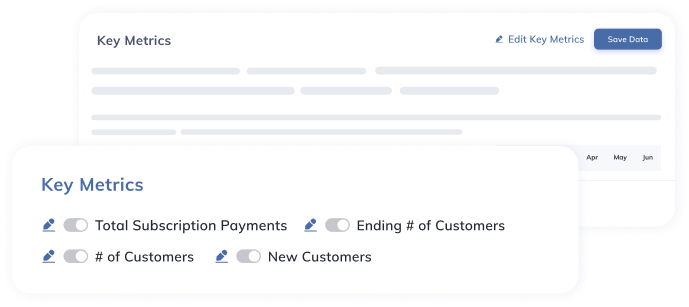
Key Operating Metrics
Load in your historical operating metrics (# of active subscribers, # of units sold, etc) to utilize them as drivers of your forecasts.
Create a summary of key metrics to add critical context to your financials and tell the full story of the business.
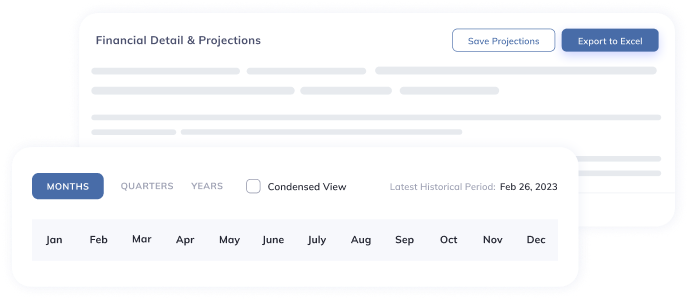
Flexible Display Options
Quickly toggle between monthly, quarterly, and annual views.
Expand or collapse years and line items to see the desired level of resolution.
Flexible Display Options
Quickly toggle between monthly, quarterly, and annual views.
Expand or collapse years and line items to see the desired level of resolution.
Insightful Reporting & Visualizations
Distill key performance metrics into easily digestible visualizations, perfect for dropping into internally and externally distributed reporting decks.
All graphs are easily available off-the-shelf without any additional effort required to generate them.
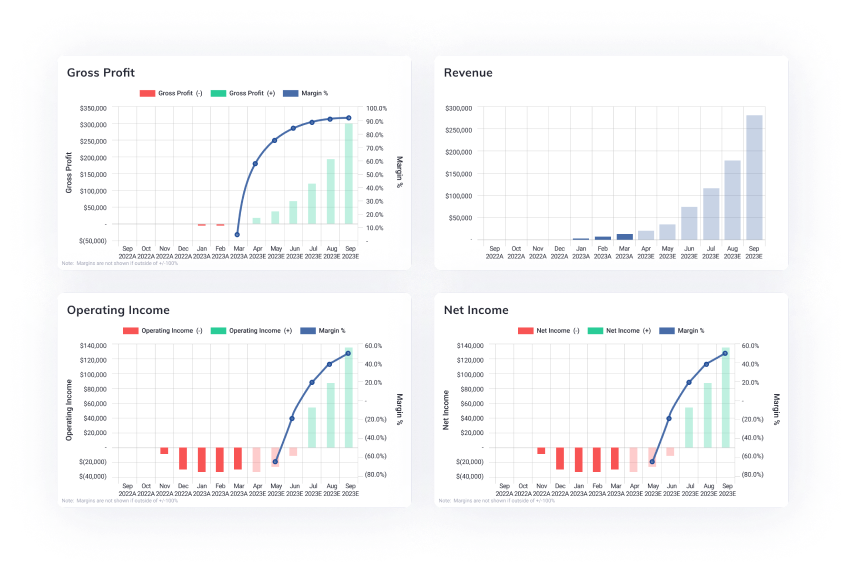
Choose from numerous graphs, including:
Income statement and profitability detail
Balance sheet metrics and leverage ratios
Net change in cash and free cash flow detail
Any operating metric relevant to your business
Insightful Reporting & Visualizations
Distill key performance metrics into easily digestible visualizations, perfect for dropping into internally and externally distributed reporting decks.
All graphs are easily available off-the-shelf without any additional effort required to generate them.
Choose from numerous graphs, including:
Income statement and profitability detail
Balance sheet metrics and leverage ratios
Net change in cash and free cash flow detail
Any operating metric relevant to your business
Measure Performance Against Plan
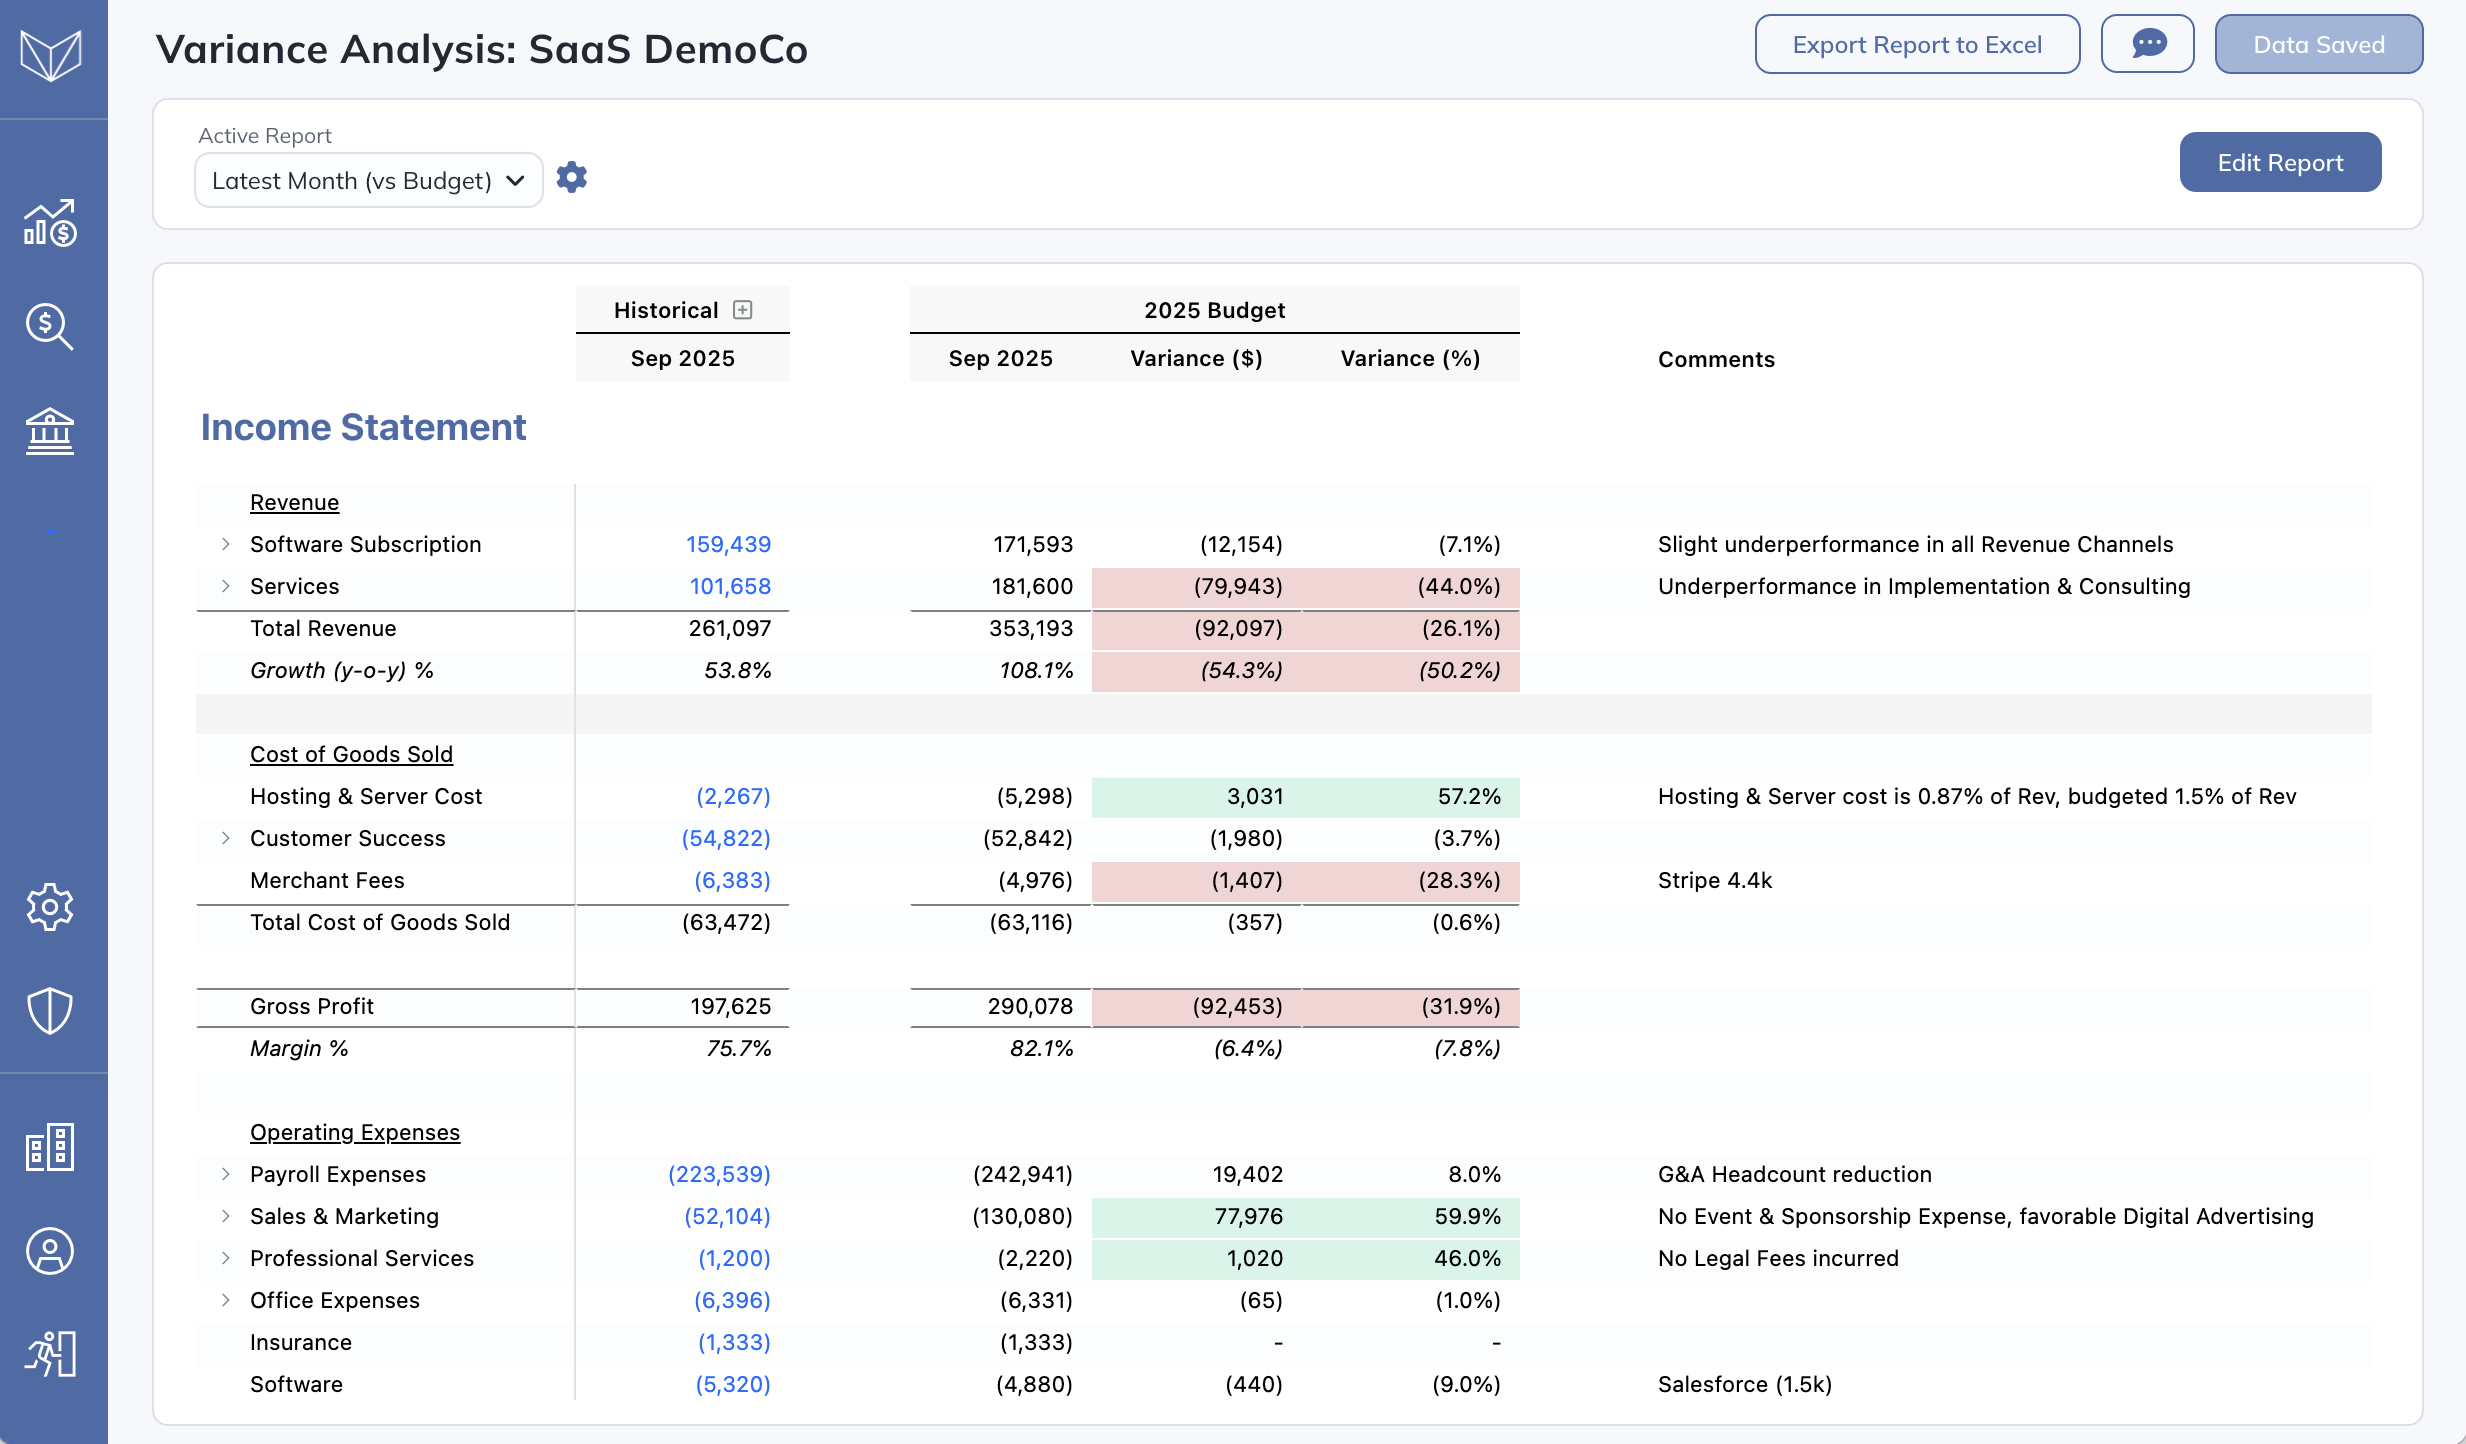
Variance Analysis is automatically generated, saving hours of manual data wrangling.
Follow best practices and be rigorous about managing your business against plan.
Quickly toggle between periods to see monthly, quarterly, year-to-date, and other variances.
Compare performance against any previously saved projection set (e.g. an Annual Budget, updated quarterly forecasts, etc).
Easily view transaction-level detail in a single click to examine why deviations may have occurred.
Add comments inline, explaining results and telling the story to key stakeholders.
Expand Actual column to see trailing three periods for additional historical context.
Measure Performance
Against Plan
Against Plan
Variance Analysis is automatically generated, saving hours of manual data wrangling.
Follow best practices and be rigorous about managing your business against plan.
Quickly toggle between periods to see monthly, quarterly, year-to-date, and other variances.
Compare performance against any previously saved projection set (e.g. an Annual Budget, updated quarterly forecasts, etc).
Easily view transaction-level detail in a single click to examine why deviations may have occurred.
Add comments inline, explaining results and telling the story to key stakeholders.
Expand Actual column to see trailing three periods for additional historical context.
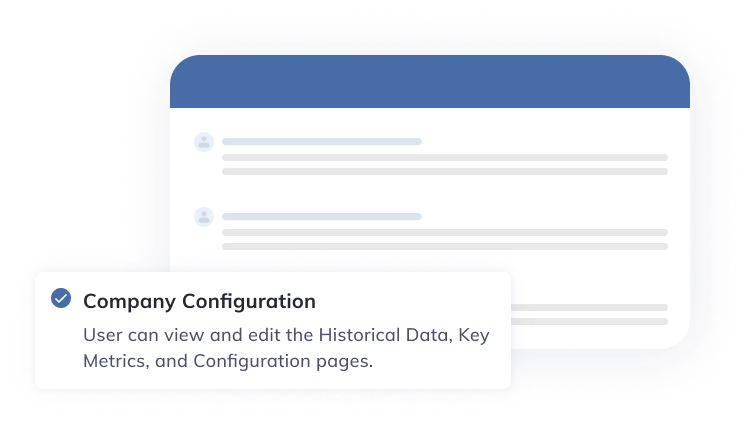
User Access
Unlimited user accounts - provide access to anyone on your team that you'd like.
Granular control over user access permissions; restrict access to transaction or compensation detail, control projection set edit access, etc.
Provide read-only views to investors, board members, senior executives, or other interested parties.
The Future of Finance
Ready to try out Modeloptic for your company?
Powerful and Intuitive Financial Reporting and Projections
© 2025 Modeloptic, LLC. All Rights Reserved.
The Future of Finance
Ready to try out Modeloptic for your company?
Powerful and Intuitive Financial Reporting and Projections
© 2025 Modeloptic, LLC. All Rights Reserved.