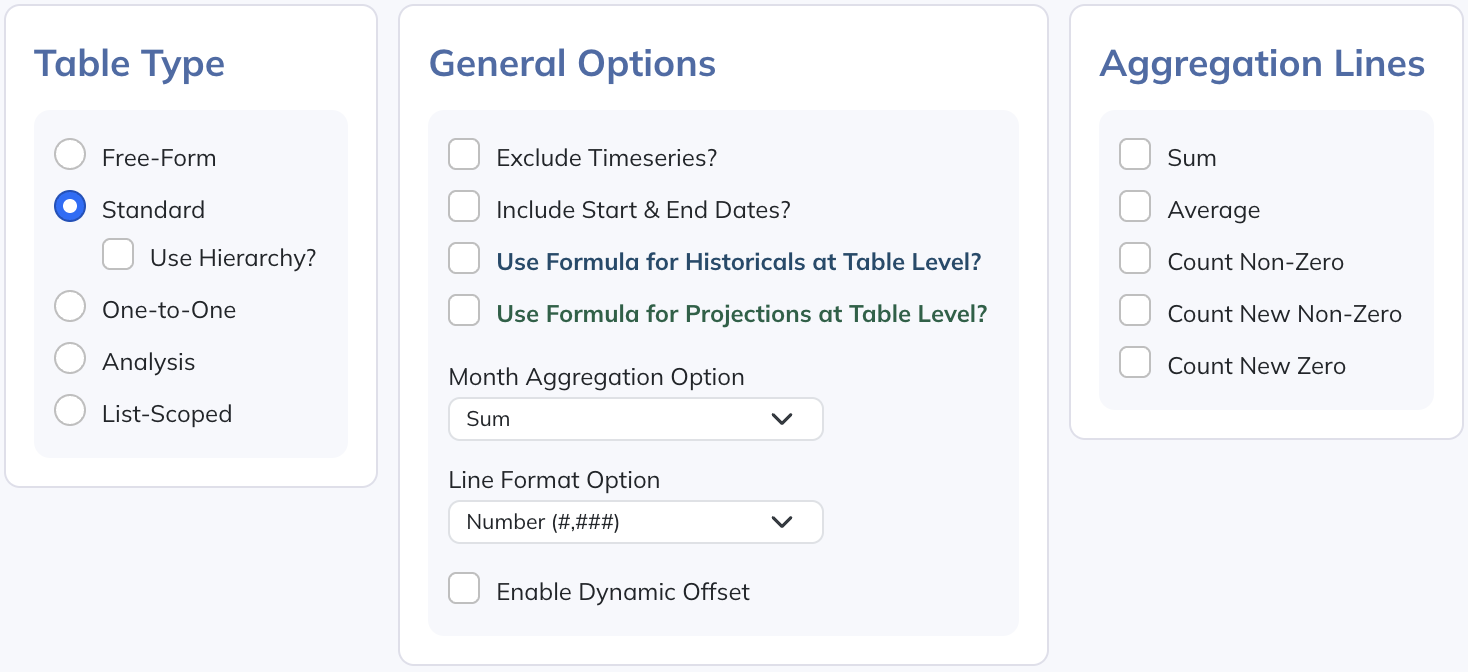
First, we'll make a "Standard" table where we list our current staff. We'll call it "Staff List (Total Expense)" because we'll have this sum up all components of our staff expense a little later. Here is what this table's settings look like so far:
It's a "Standard" table type because it contains a collection of like elements, and it's going to serve as the parent table that other related tables will reference.
Let's add a few rows to our table, one for each existing person on our staff:
(When importing your actual roster, Modeloptic has tools to make that easy, which you can learn more about here.)
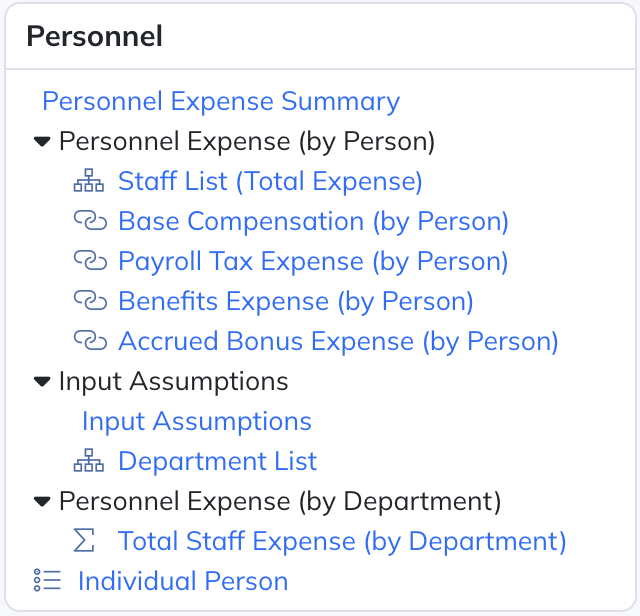
Next, we'll set up some related tables that we know we'll need, which include the following:
- Base Compensation (by Person)
- Payroll Tax Expense (by Person)
- Benefits Expense (by Person)
- Accrued Bonus Expense (by Person)
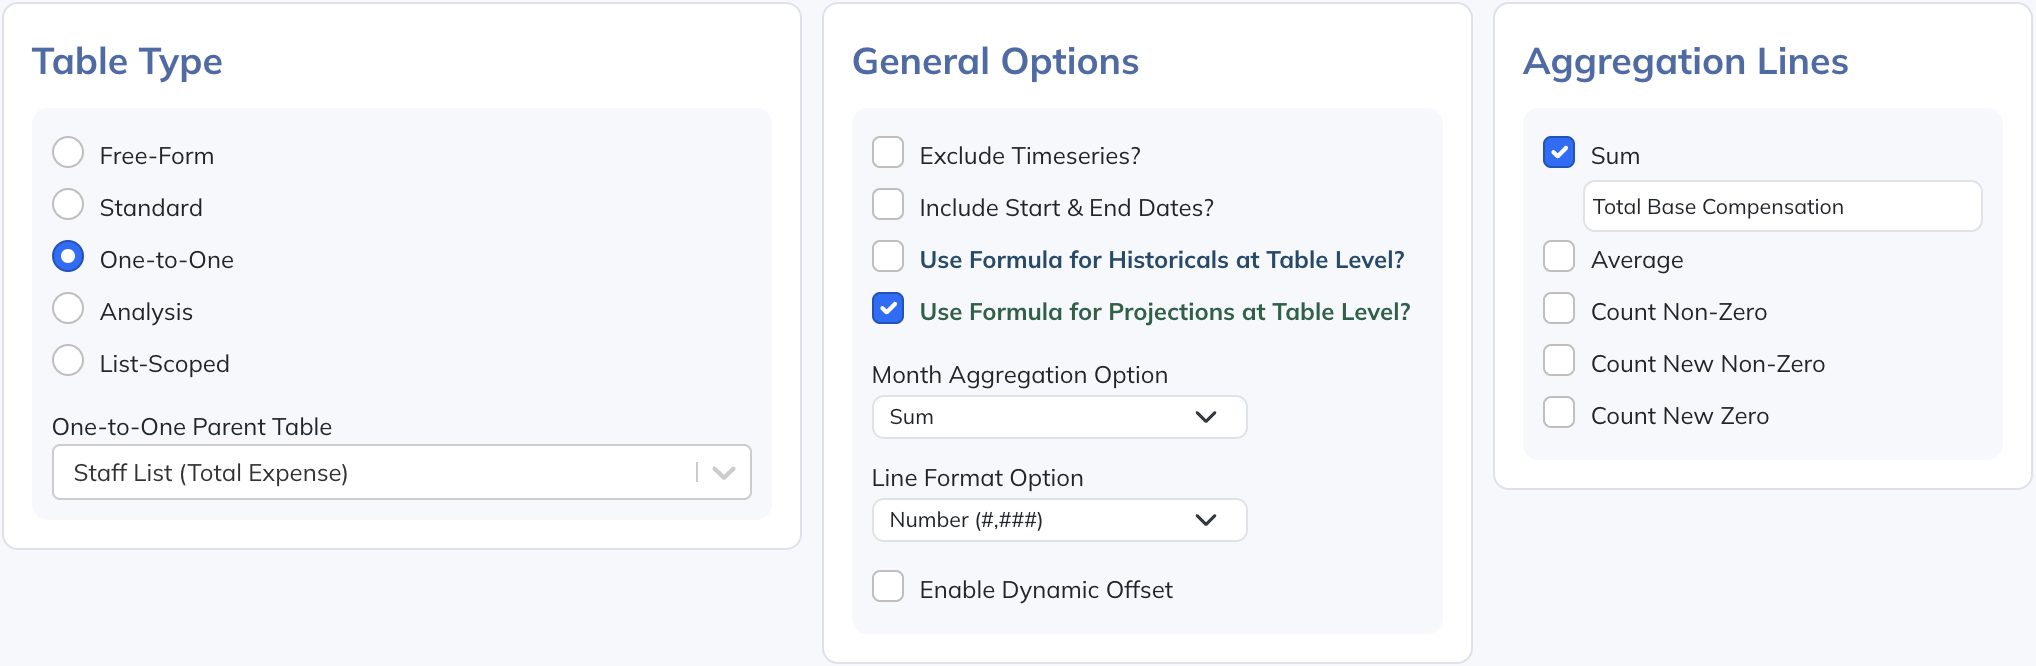
Each of these will be a "One-to-One" table type that references the main Staff List table that we created above, which means each will mirror the row structure of the Staff List table. When staff members are added, deleted, reordered, or renamed in the parent Staff List table, the change will automatically be reflected in all child One-to-One tables as well.
Here's what the settings for each of the One-to-One tables looks like now:
Note that we've put in the following settings:
- The "Use Formula for Projections at Table Level?" flag is on, which means we'll be able to use a single formula to forecast all rows in this table (versus needing to create an equivalent formula in every row and cell within the table)
- The "Aggregation Lines: Sum" flag is on, which means there we'll see a total row at the bottom of the table that sums up each of the rows above
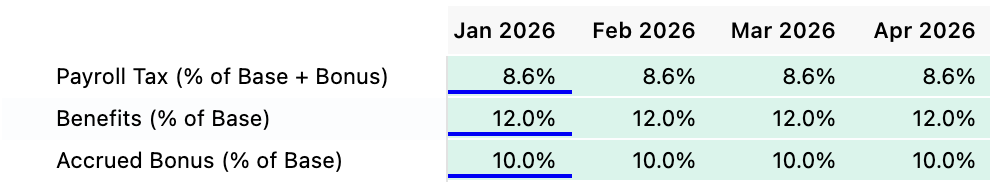
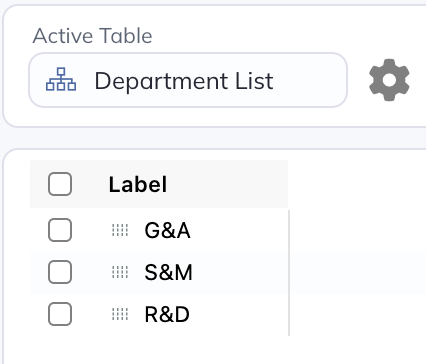
Next, we'll add a "Free-Form" table where we'll put some key assumptions that we can then reference:
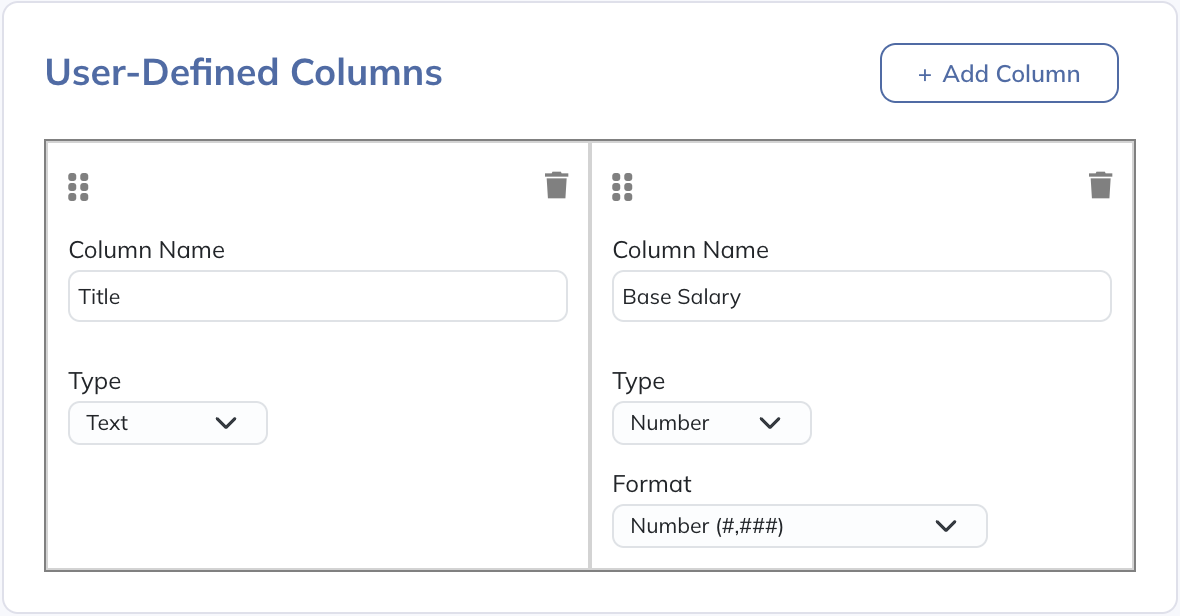
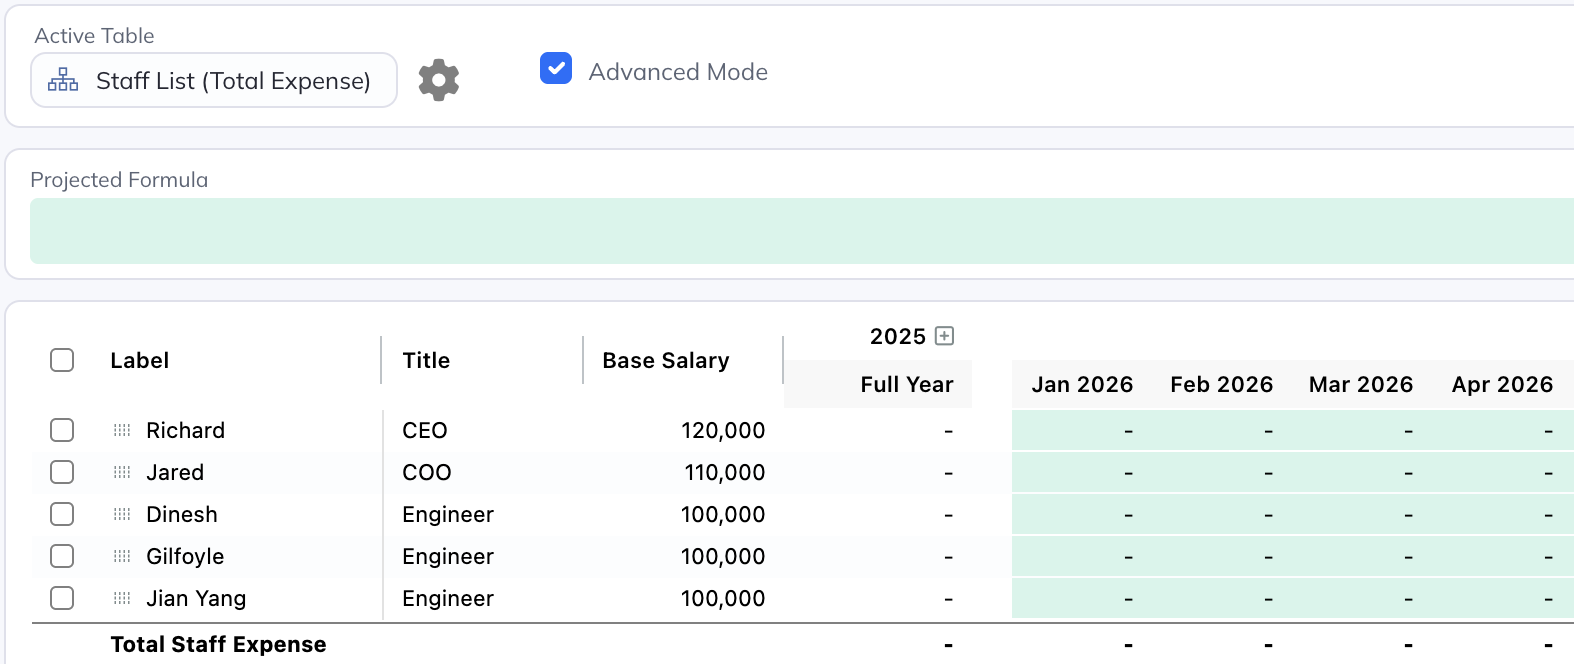
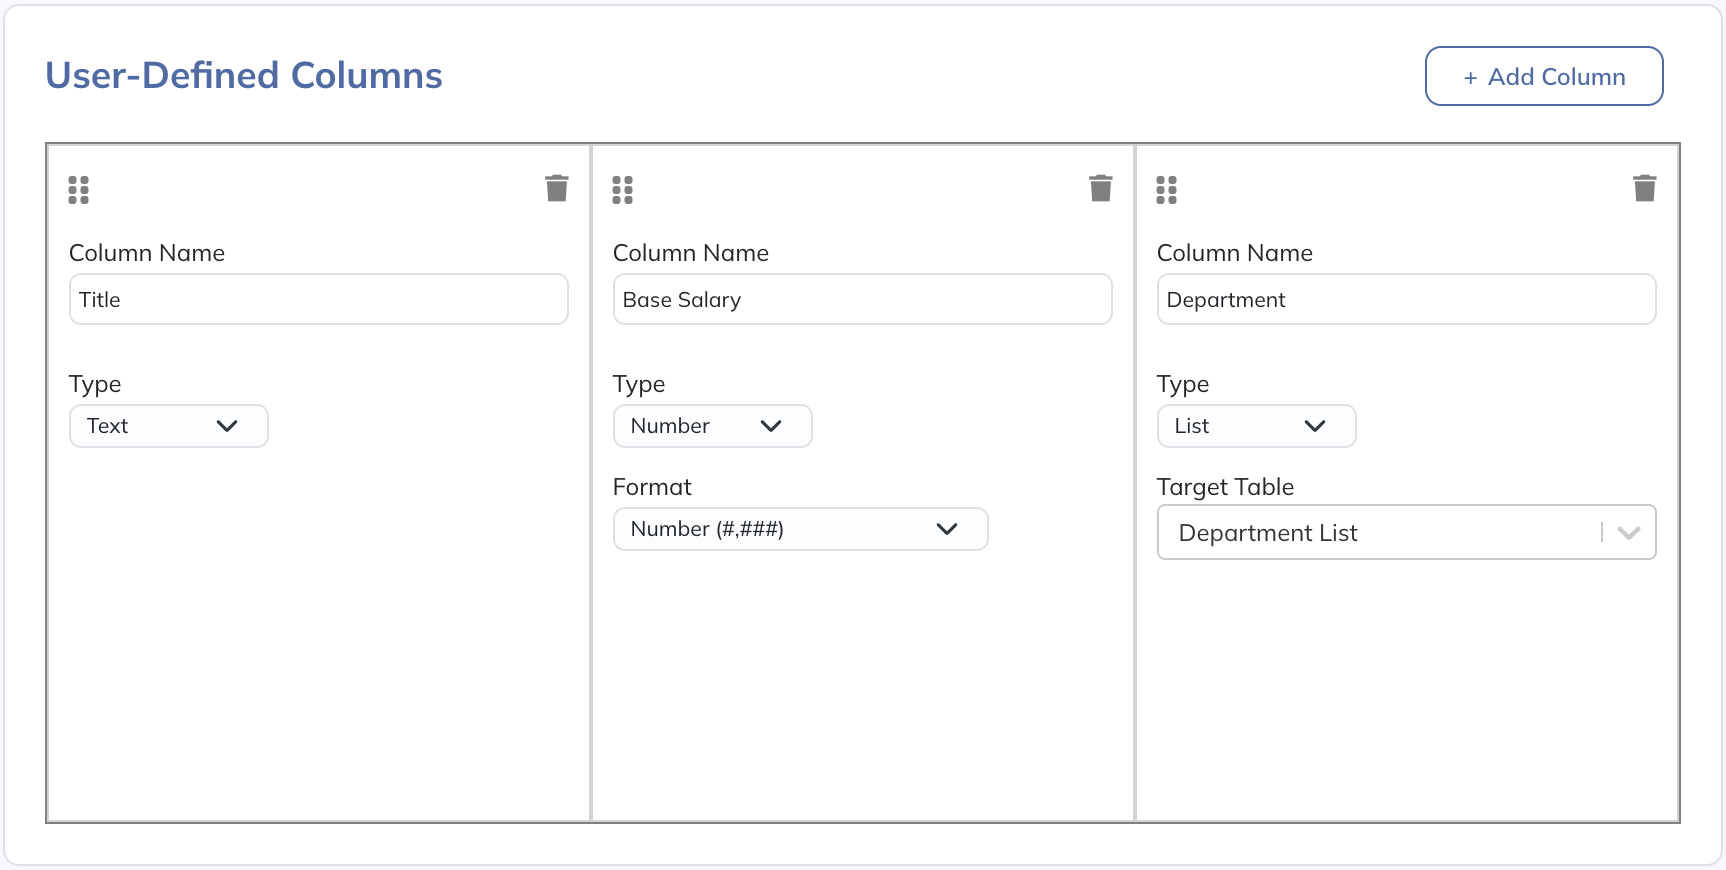
Now we'll go back to our Staff List table and add in some more detail. We want to add two custom columns:
- A text column to input the person's title
- A number column to input the person's base salary (which we can then reference in formulas)
While we're in the settings for this table, we'll turn on the same two additional flags that we did for the child tables:
- We turn on "Use Formula for Projections at Table Level?" because this table is going to sum up the child expense tables
- We turn on the "Aggregation Lines: Sum" flag to show a Total Personnel Expense row for this table
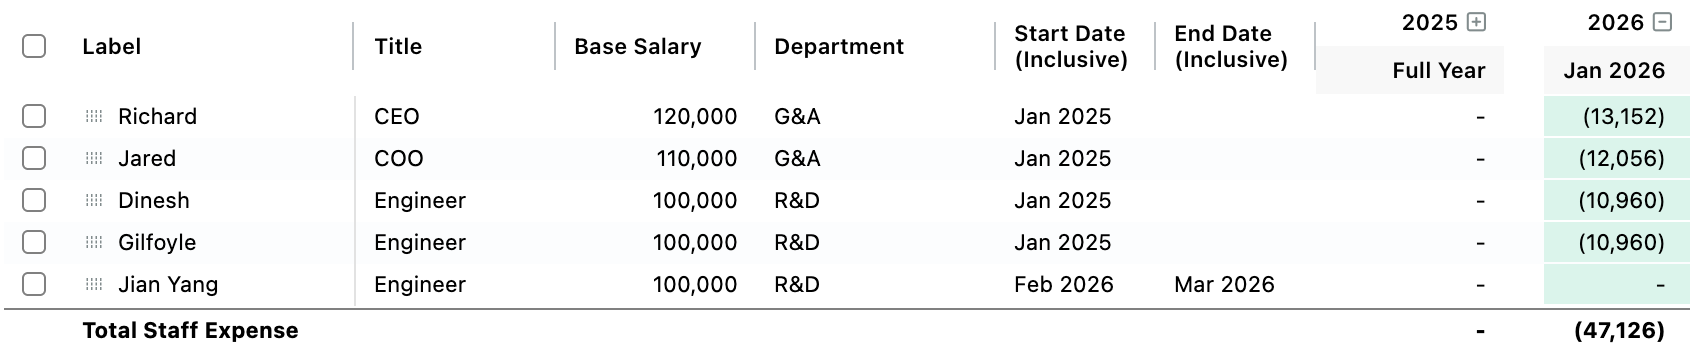
Our Staff List table now looks like this (in Advanced Mode):
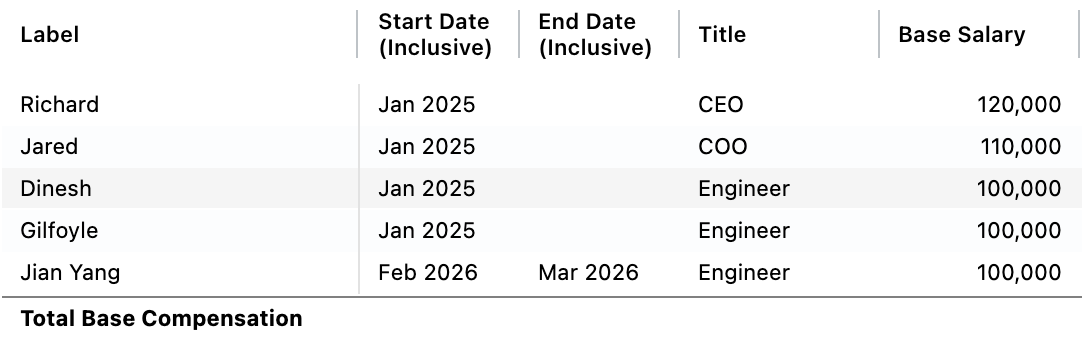
Now let's go set up our Base Compensation expense calculations.
First, in the Base Compensation table's settings, we'll turn on the "Include Start & End Dates?" flag so we can indicate date ranges for each of our staff members (to account for new hires and terminations), which will add two new columns to each row:
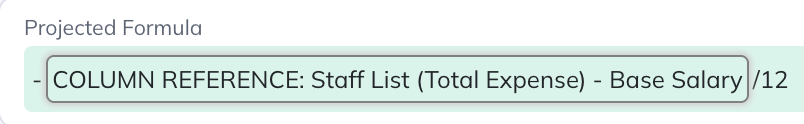
Then we'll create a table level formula to calculate base compensation expense:
This formula:
- Looks up the value we entered into the "Base Salary" column for each person
- Divides it by 12 (since we entered an annual salary number and want that broken down into monthly amounts)
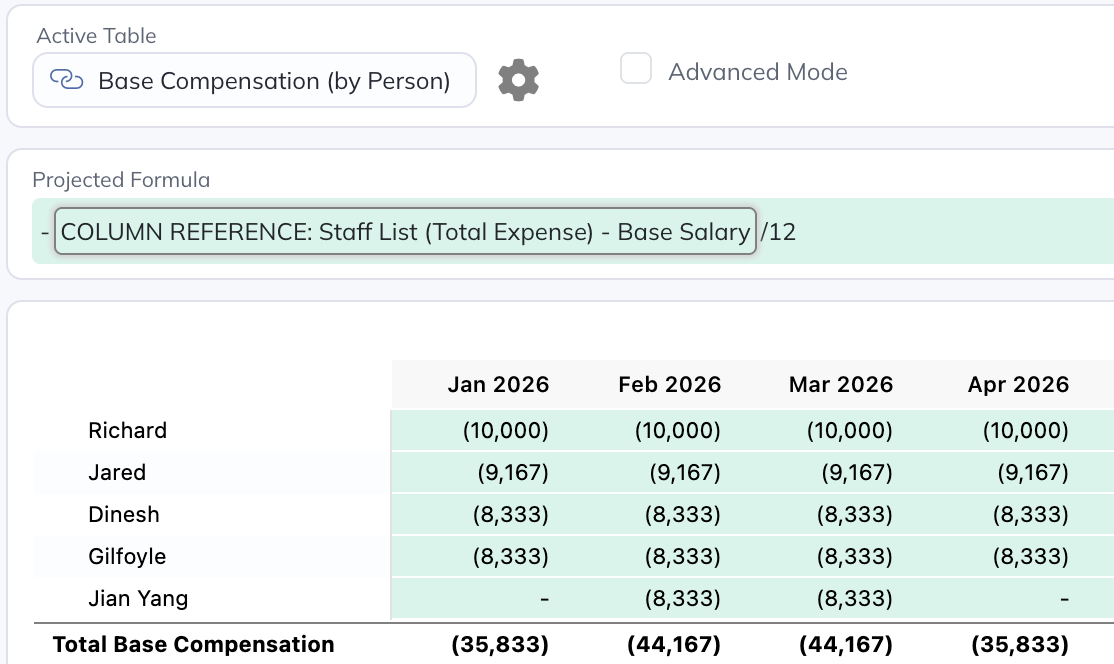
We can see that these calculations now show up in each of the months:
A few items to note:
- Even though we defined the "Base Salary" column on the "Staff List (Total Expense)" table, we can reference it from here because the tables have a Standard/One-to-One relationship. One-to-One tables can also reference columns defined on their sibling tables
- All values outside of the Start/End Date range on a given row will be shown as zero
- By convention, we enter expenses as negatives
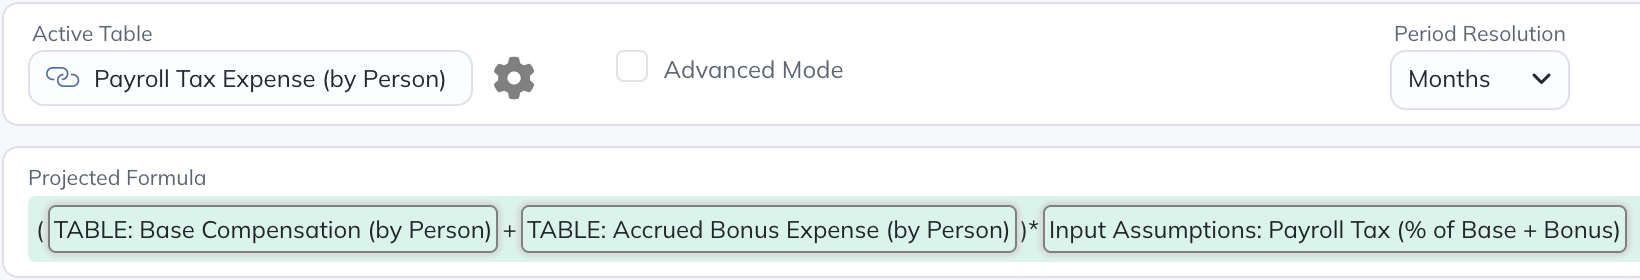
Next, we can enter the formulas for the payroll tax table:
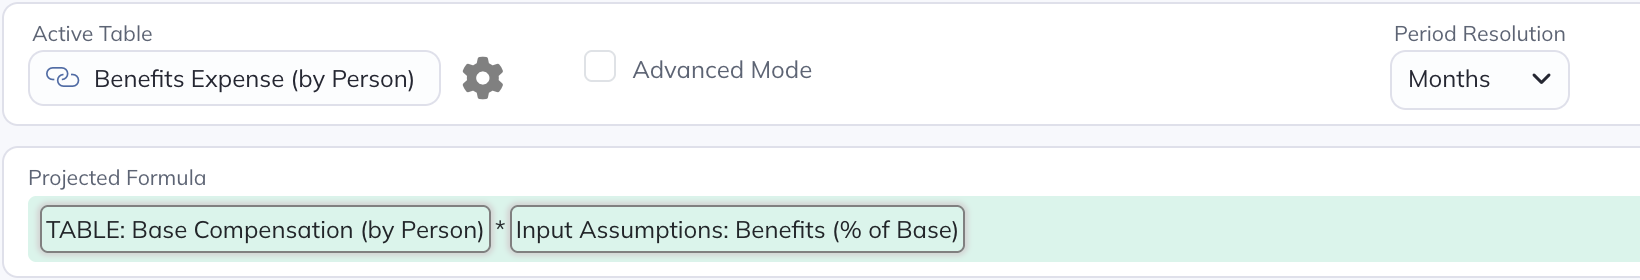
And for the benefits table:
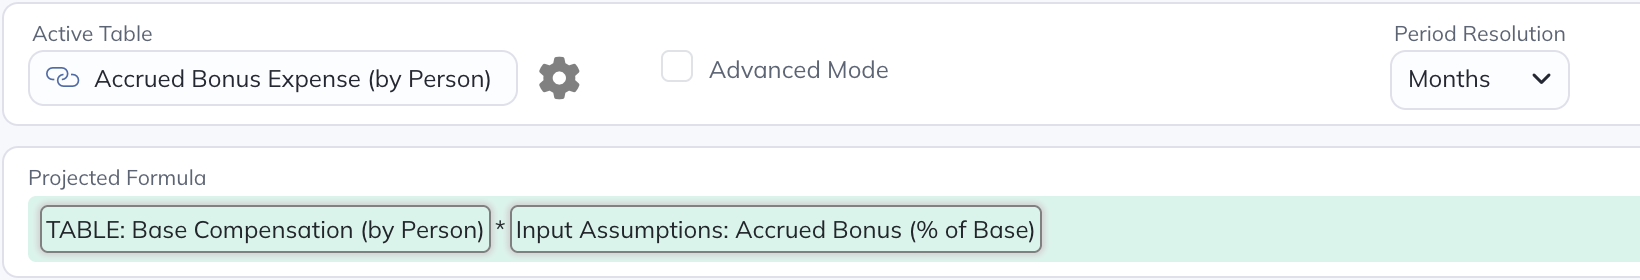
And for the accrued bonus table:
Note that each of these reference the Personnel Assumptions table we created above.
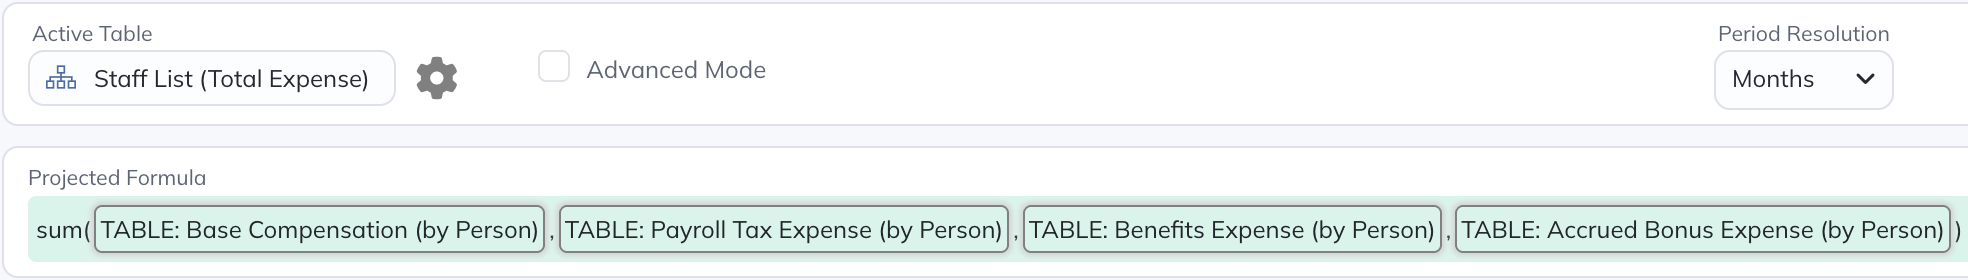
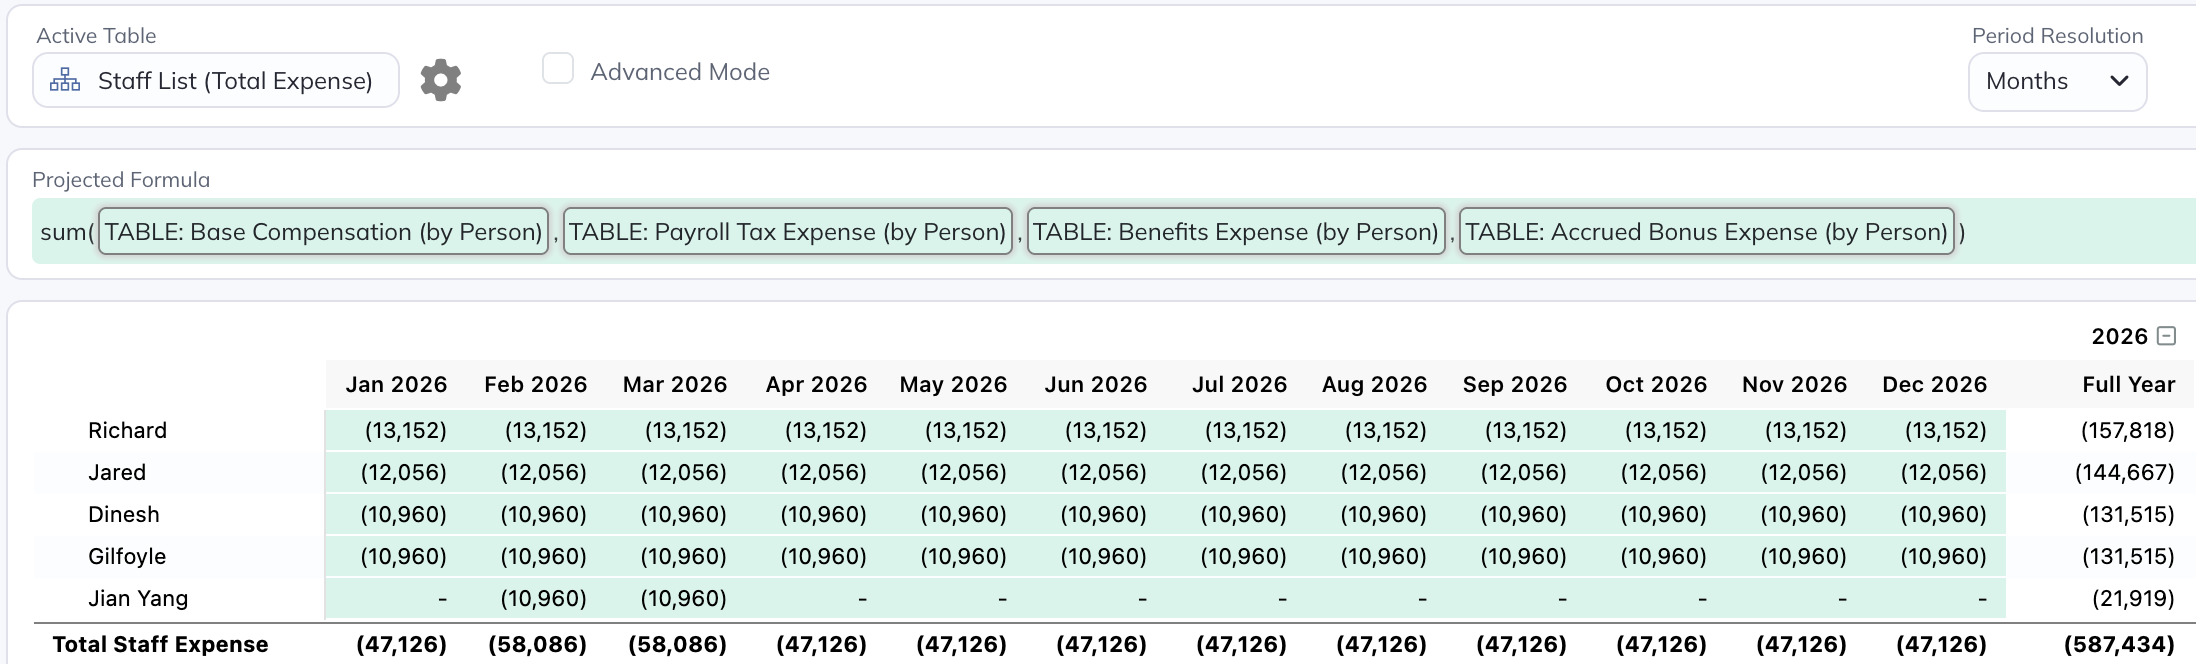
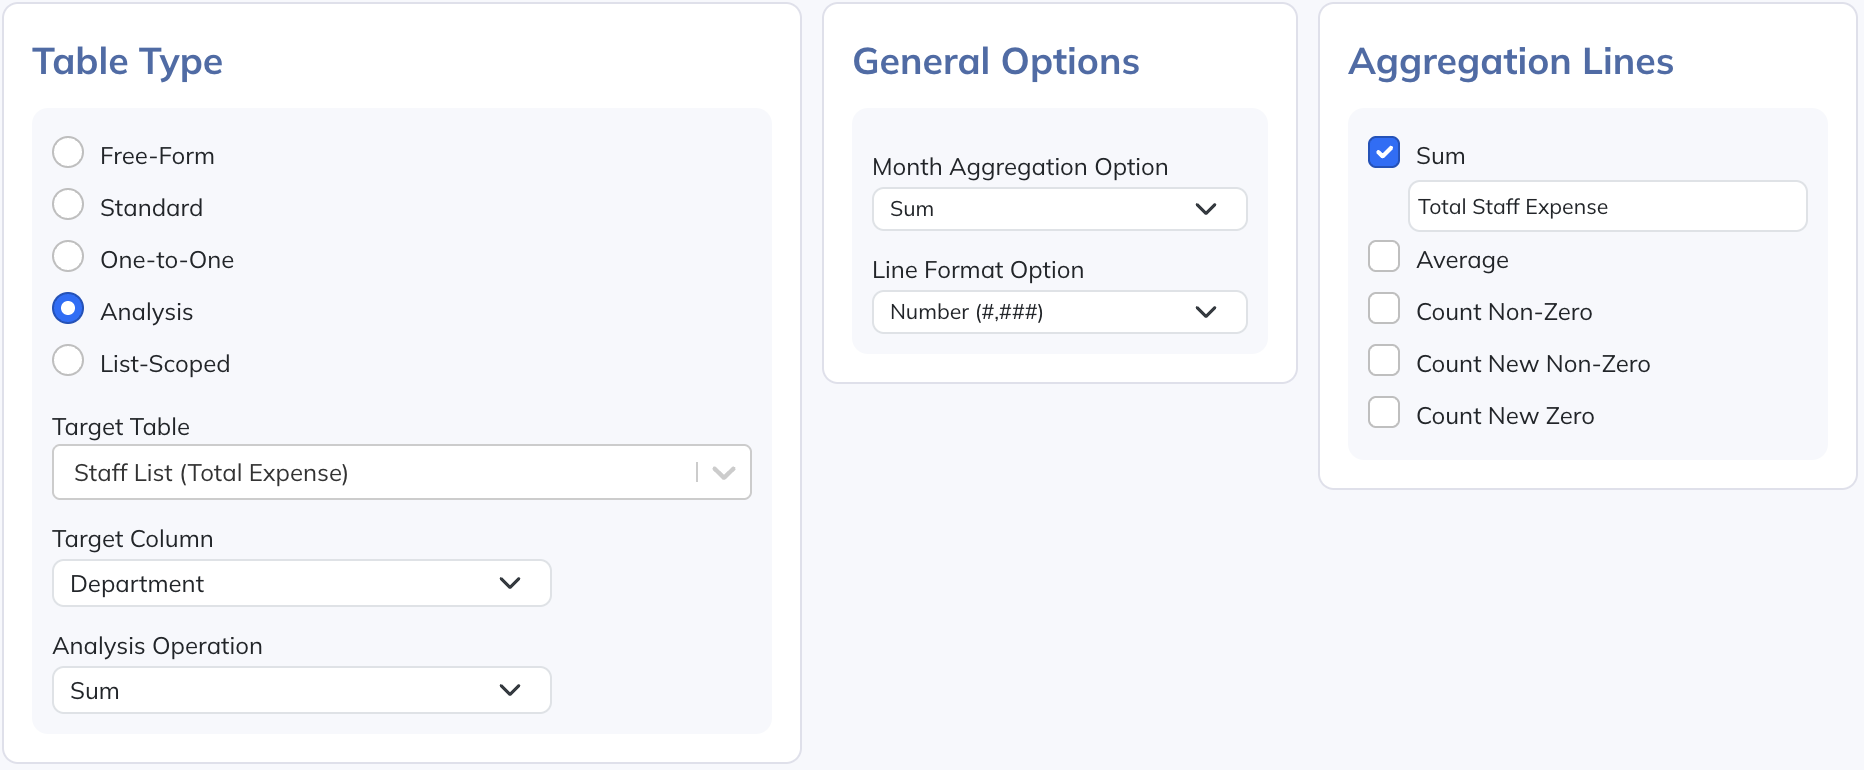
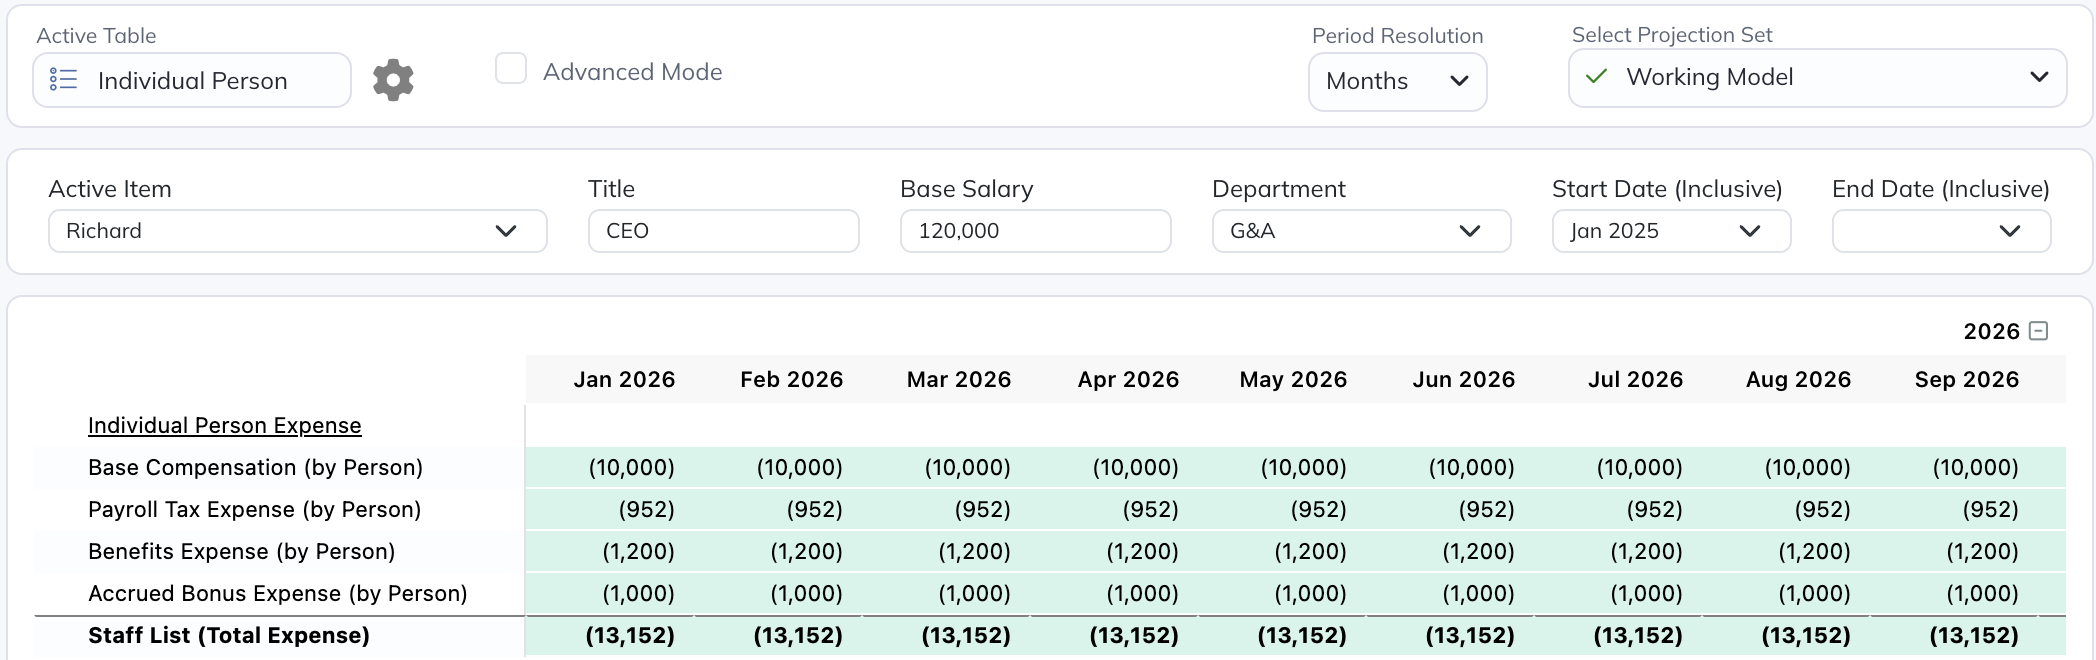
Finally, we can enter the formula for the "Staff List (Total Expense)" table:
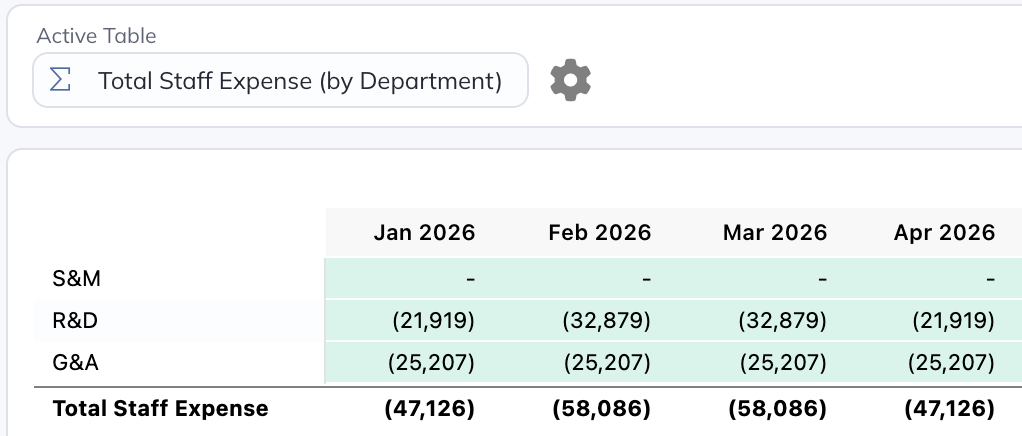
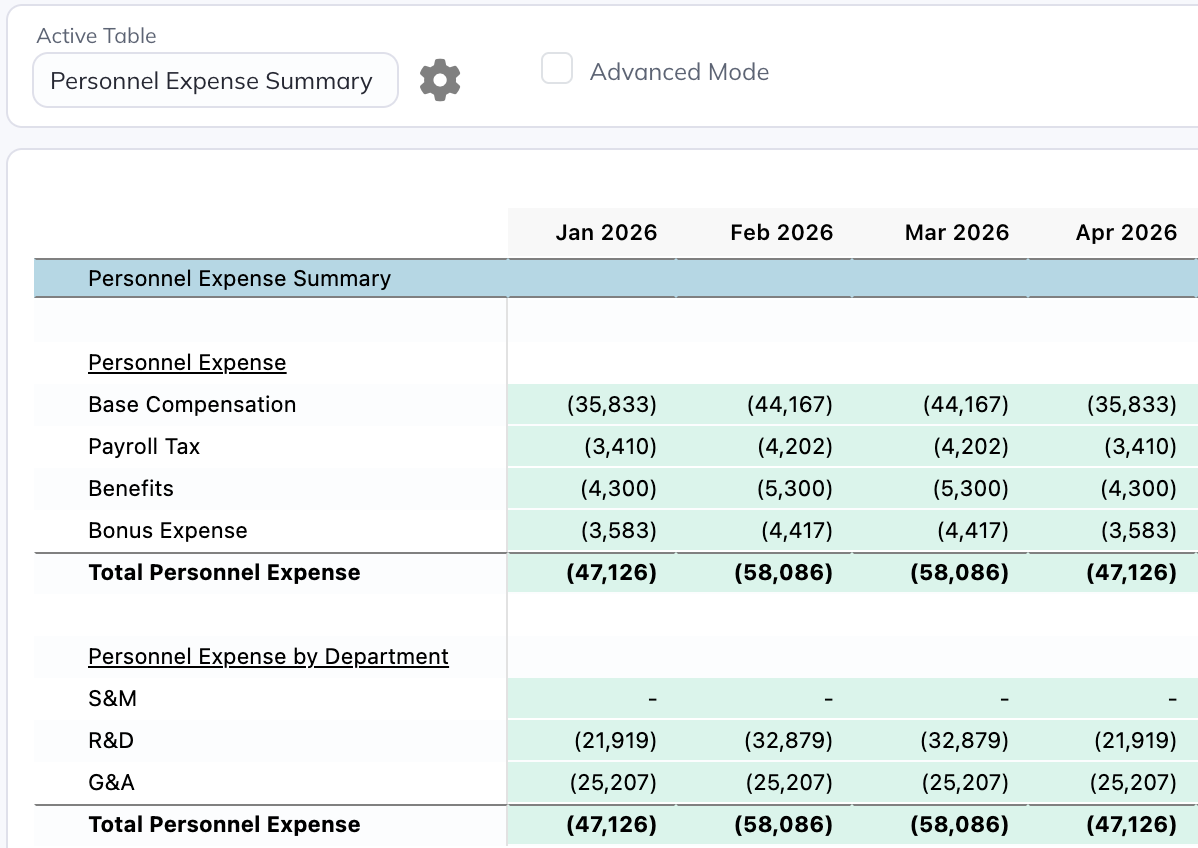
The resulting value calculations look like this:
With only a few formulas, we were able to set up our whole personnel expense forecast.