Thanks for signing up for our free trial! Since you'll be uploading your historical financials via Excel, this guide will walk you through how to do that, as well as how to set up your Modeloptic chart of accounts and configure your reports.
Modeloptic Crash Course
Overview
Set Your Desired Time Period
First navigate to the Configuration page. You can modify your company's start and end years here if you'd like:
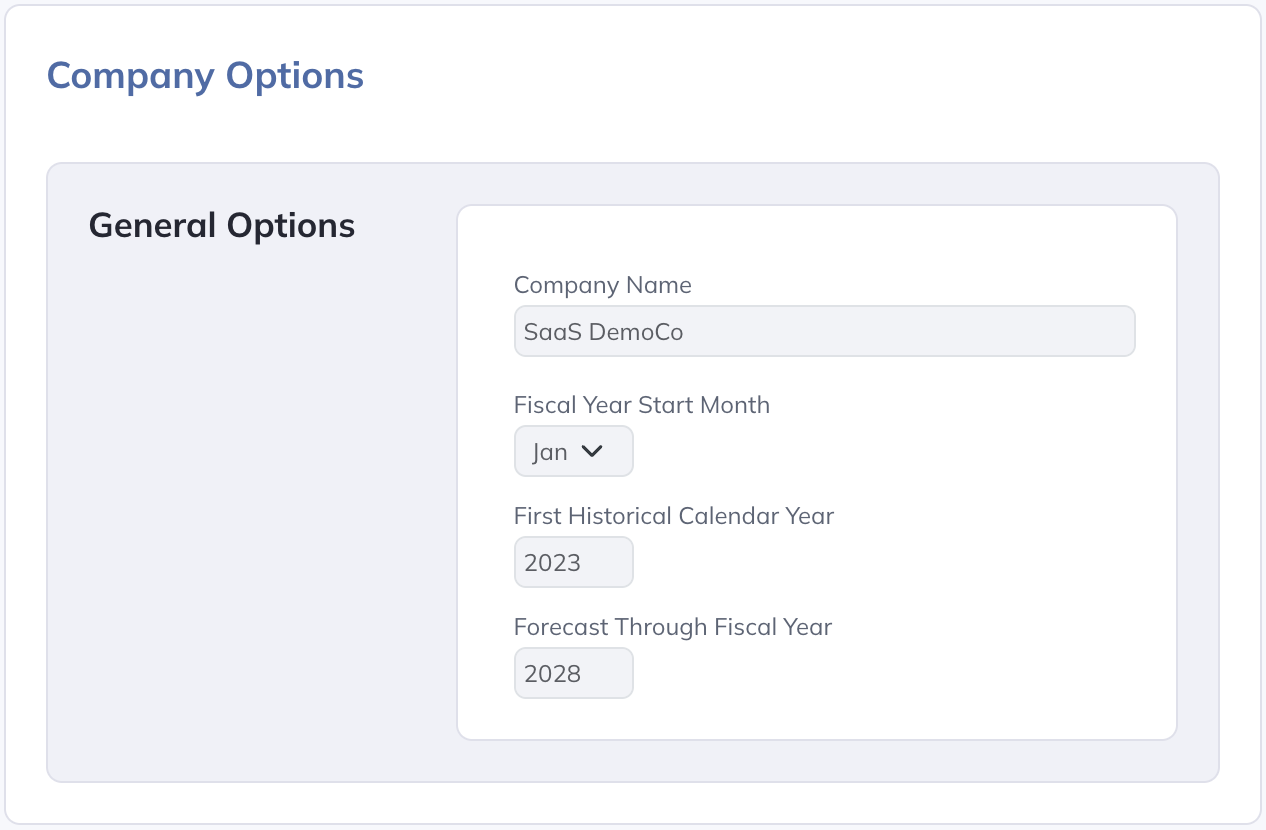
Make sure that the First Historical Calendar Year that you select here corresponds to the first year of data in the Excel file(s) containing your financials that you'll be uploading. You can import as much history as you'd like, but we recommend importing the past 2-3 years as a starting point.
Download Your Financial Data from Your Accounting System
Next, you'll need to download your financials with monthly detail into Excel format from your accounting system. You'll need your income statement, balance sheet, and statement of cash flows.
The data in the file you're uploading should look something like this:
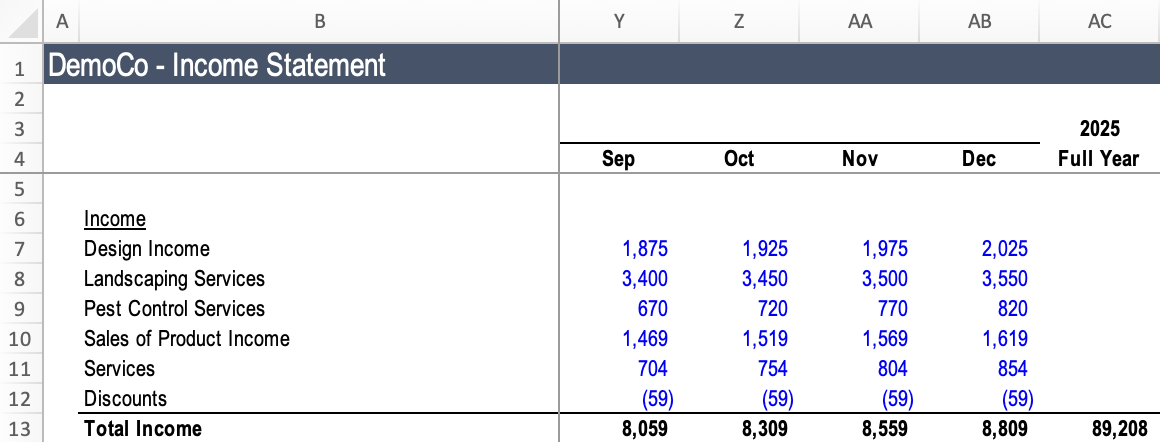
All data should be on one tab per financial statement, there should be one column for each month of data, each month of data should be in consecutive columns within each year, and the most recent period should be on the right.
Upload Your Financial Data
To upload your data, navigate to the Historical Data page. Make sure your Latest Historical Period is set to the most recent period for which you'd like to load in data:

Click into the "Financial Statements" Data Connection, and you should see a section that looks like this:
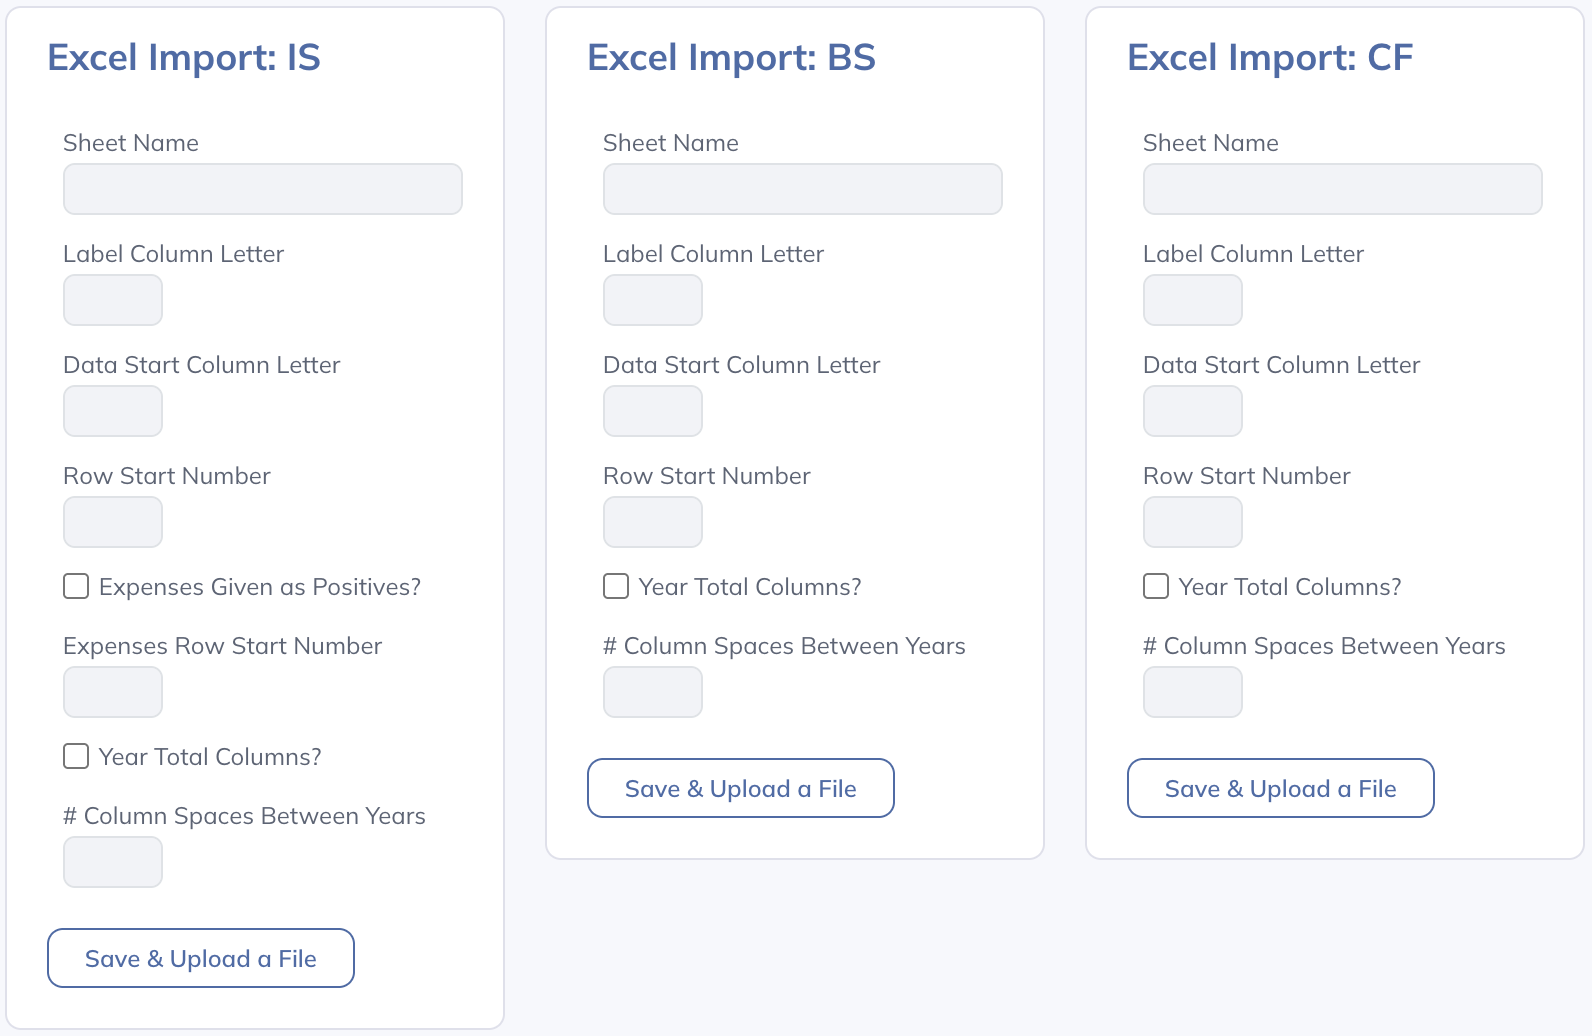
Before uploading each file, set the import options to correspond with the file that you're uploading. The options to set here are as follows:
- Sheet Name: The name of the sheet in the file you're uploading that should be imported for the given financial statement.
- Label Column Letter: The letter of the column that contains the labels for each line item.
- Data Start Column Letter: The letter of the column where the numerical data begins. This should be the column that corresponds to the first fiscal month in the First Historical Calendar Year that has been set on the Configuration page.
- Row Start Number: The row number where you would like the import to begin (you'll presumably want to exclude header rows).
- Expenses Given as Positives?: By convention, Modeloptic displays expenses as negative numbers. If the expenses shown in the file you're uploading are positive, check this box (only applicable for the income statement).
- Expenses Row Start Number: The row on which the expenses begin (only applicable for the income statement). If you've checked the "Expenses Given as Positives?" box, values from this line forward will have their signs flipped.
- Year Total Columns?: Check this box if you have columns interspersed within your monthly data columns that sum up the months in a given year.
- Col Spaces Between Years: Indicate the number of blank columns that appear between each year of data (enter 0 if there are no such columns).
Once you upload a file, you should see a success message. After loading in data for all three financial statements, you're ready to move on to the next step, which is to create a first draft of your chart of accounts within Modeloptic.
Chart of Accounts
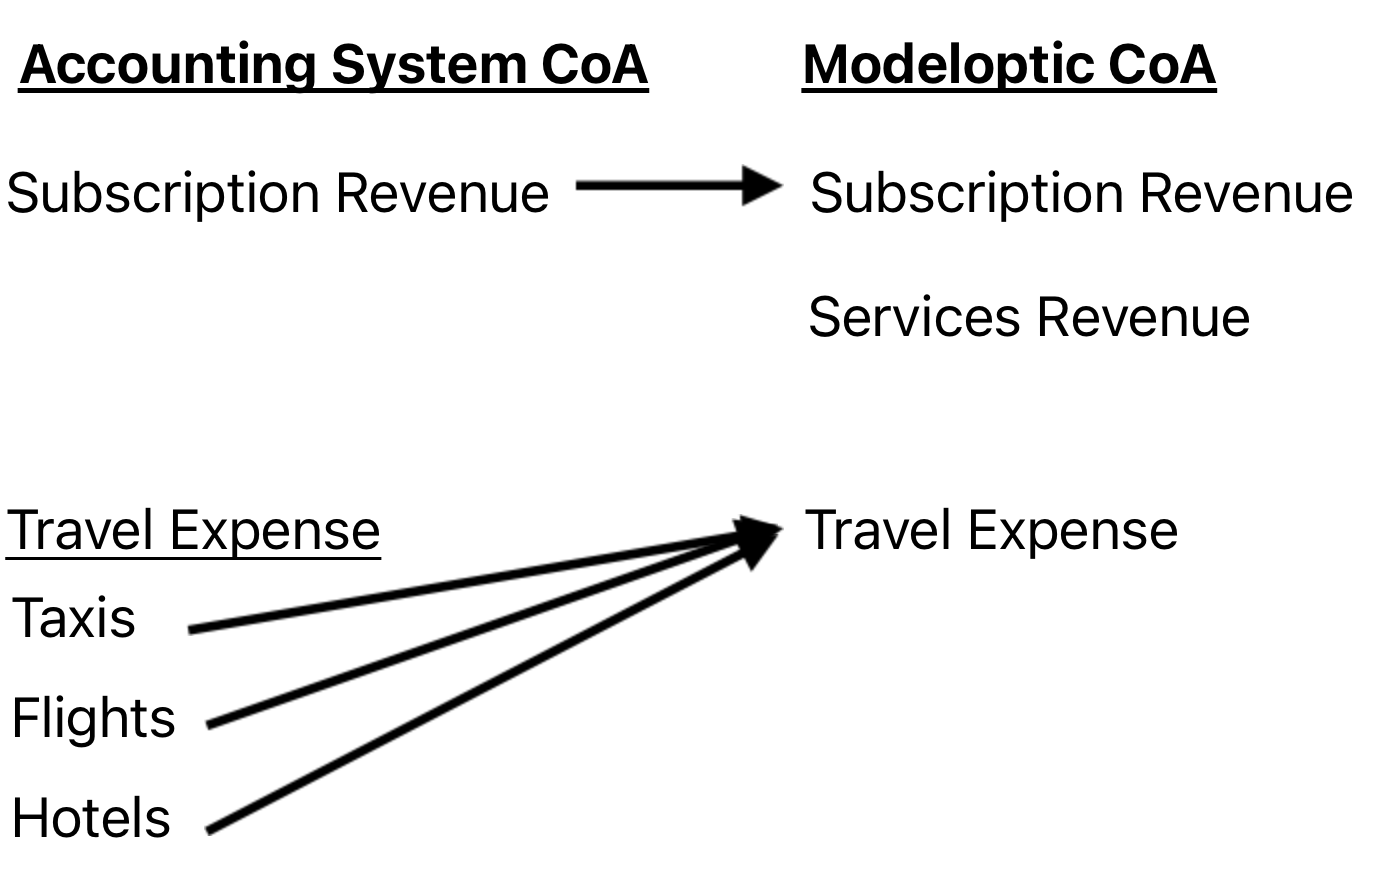
There are two different charts of accounts that you'll be working with: The one that's defined within your accounting system (which presumably aligns with the chart of accounts shown in the Excel files you uploaded), and the one that's defined within Modeloptic.
Companies will often have a higher level chart of accounts for the sake of forecasting and reporting versus a lower level chart of accounts within their accounting system. For example, in your accounting system, you might have lines for "Taxis", "Flights", and "Hotels", but in Modeloptic you might only want a single "Travel" line.
You can build out your Modeloptic chart of accounts on the Configuration page:
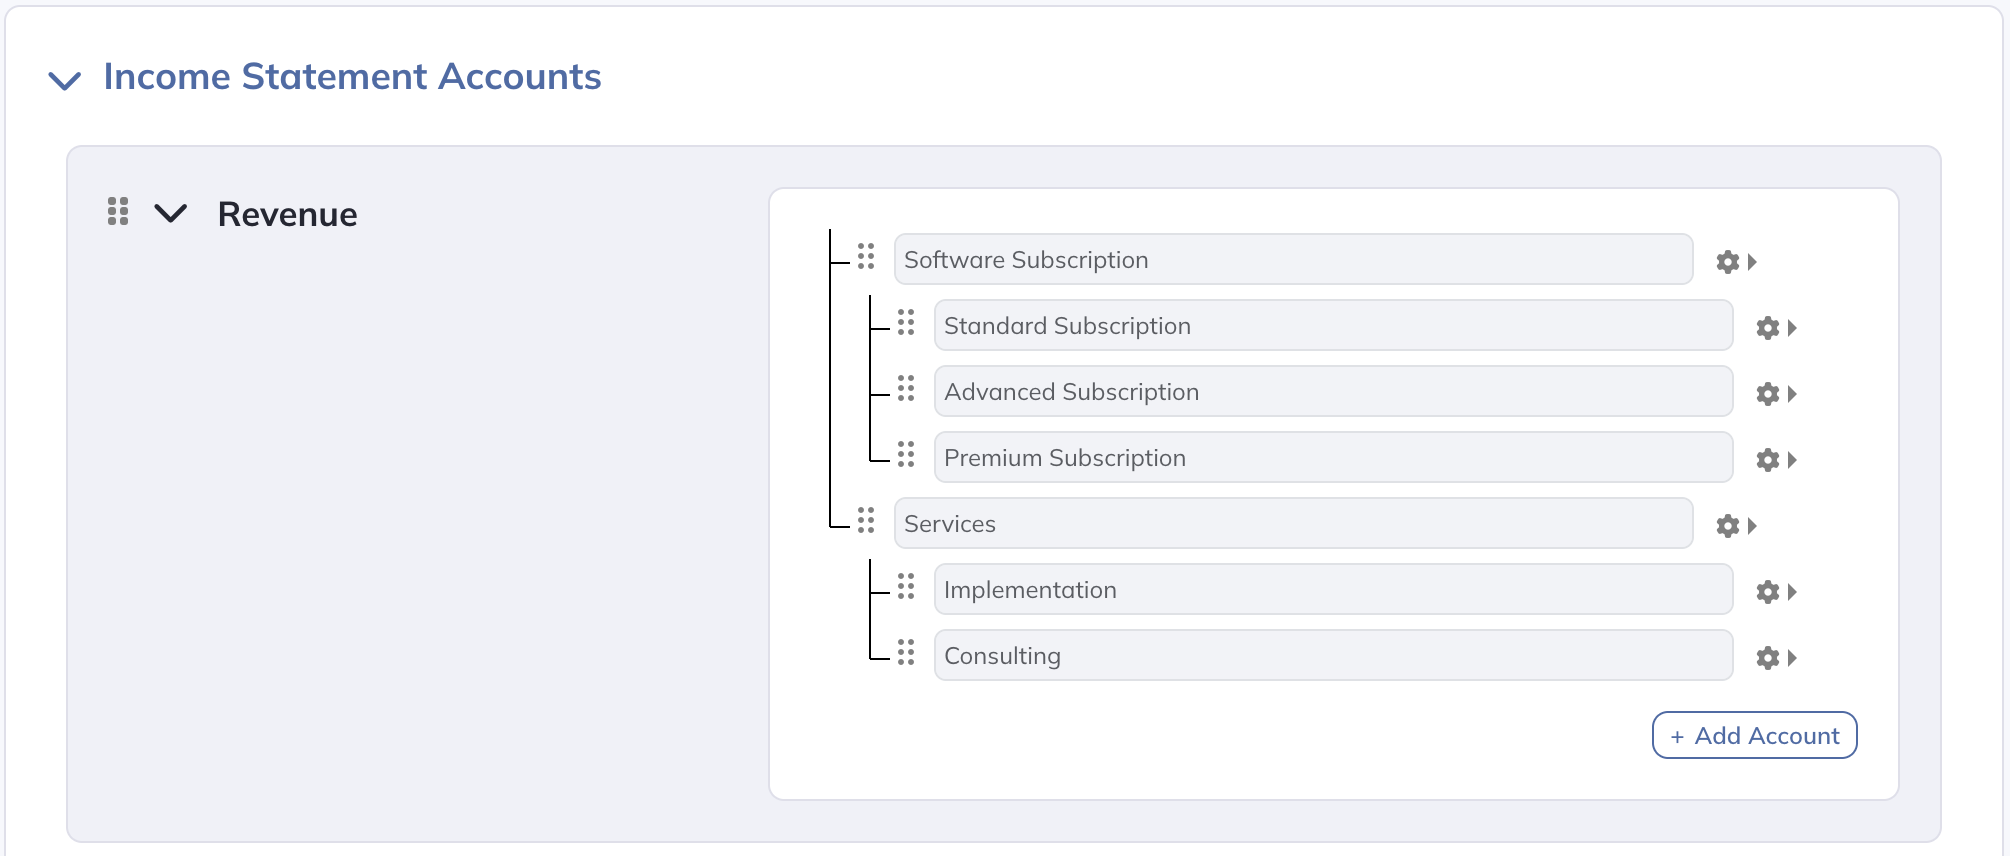
For more detail on how to build out your chart of accounts, including how to create linkages between the three financial statements, see the Chart of Accounts section of the documentation.
Schema Mapping
Once you've uploaded your historical financials and created a first draft of your chart of accounts in Modeloptic, the next step is to create the mapping between the line items present in your Excel files (which presumably align with your accounting system's chart of accounts) and your chart of accounts within Modeloptic.
You can do that on the Historical Data page, within the Schema Mapping section:
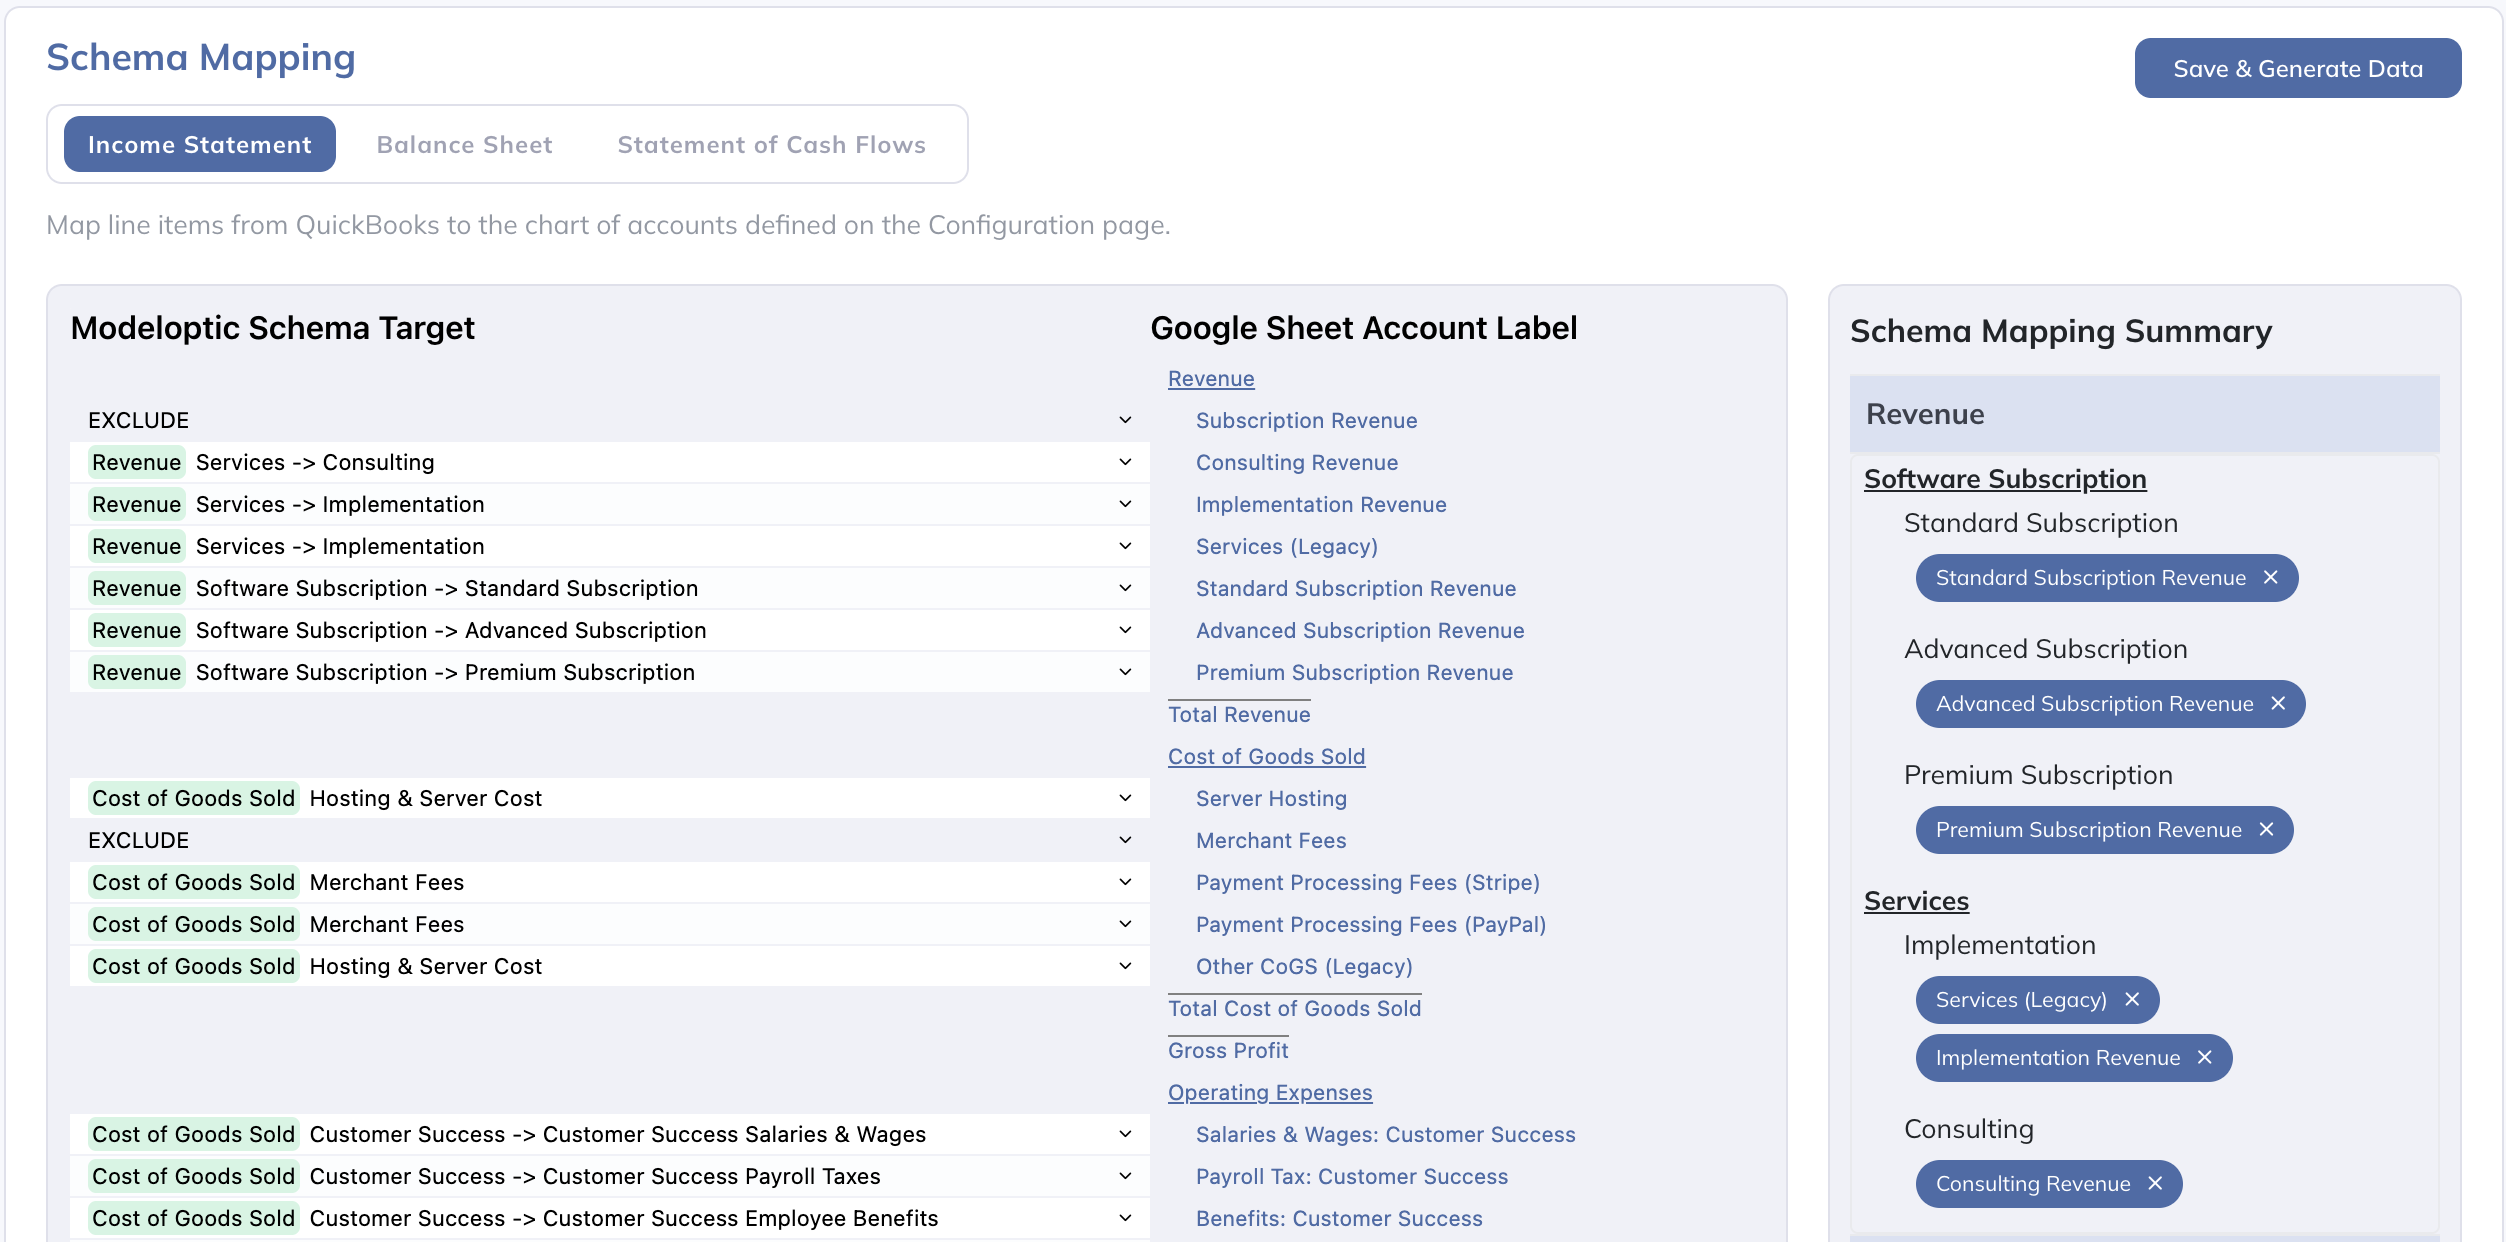
Once you've finished mapping all of your line items, click the "Save & Generate Data" button:

For more detail on anything described in this section, see the Schema Mapping section of the documentation.
Create and Modify Reports
There are three distinct pages within Modeloptic that specifically provide reporting capabilities:
- Dashboard: This is where reports can be set up for use within the browser in a free-form manner.
- Reports: This is where reports are structured within pages and can be compiled into deliverable documents that can be generated to PDF on demand.
- Variance Analysis: While the above two pages provide variance capabilities as well, this page is specifically set up to facilitate in-depth variance analysis, including the ability to dig into transaction-level detail for any particular account.
On all of these pages, you can configure your reports to capture the specific nuances of your company.
By default, most reports are set up to automatically update when you roll forward your latest historical period. This can save you a ton of time versus needing to manually update all of the components of your report manually each month.
To learn more about each of these pages, see the following sections of our documentation:
Next Steps
There is a lot more to know, but this should be enough to get you started!
As a reminder, building out an entire company forecast is an intensive task. This trial is just intended to give you a taste of what Modeloptic is capable of to help you make a decision if it will fit your needs.
If you'd like to learn more about how Modeloptic works, feel free to take a look through our documentation.
If you have any questions for us, please feel free to contact us. We'd love to hear from you!
Powerful and Intuitive Financial Reporting and Projections
© 2025 Modeloptic, LLC. All Rights Reserved.
The Future of Finance
Ready to try out Modeloptic for your company?
Powerful and Intuitive Financial Reporting and Projections
© 2025 Modeloptic, LLC. All Rights Reserved.