Thanks for signing up for our free trial! Since we have an integration with your accounting system, you'll already have a starting point for your chart of accounts built in your account.
The first topic we'll cover is how to modify your chart of accounts.
Your initial chart of accounts within Modeloptic was simply cloned from your accounting system, which you will likely want to modify.
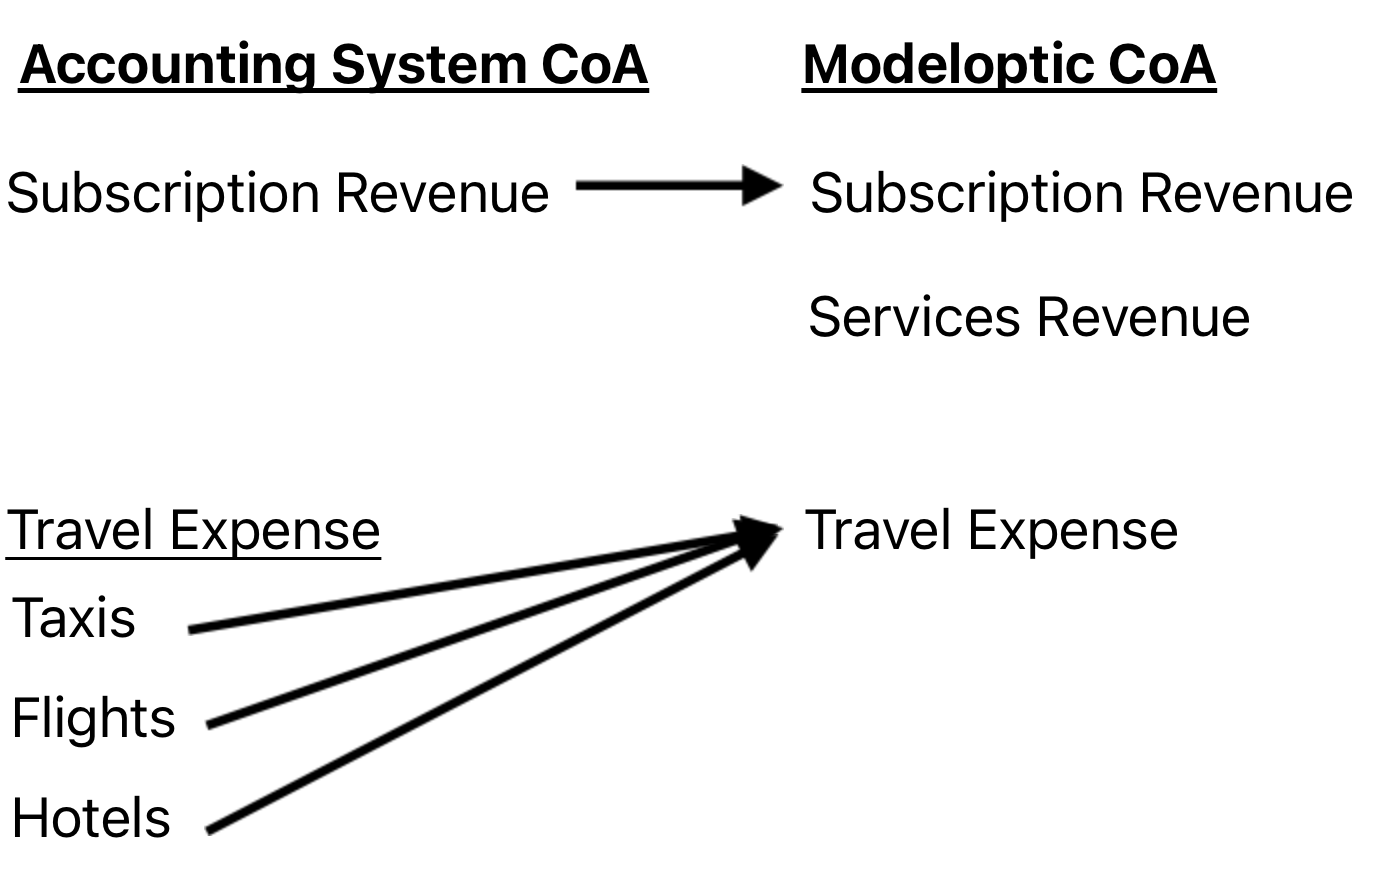
Companies will often have a higher level chart of accounts for the sake of forecasting and reporting versus a lower level chart of accounts within their accounting system. For example, in your accounting system, you might have lines for "Taxis", "Flights", and "Hotels", but in Modeloptic you might only want a single "Travel" line.
You might also have new line items forecast in the future that don't exist historically.
For detail on how to modify your chart of accounts within Modeloptic, see the Chart of Accounts section of the documention.
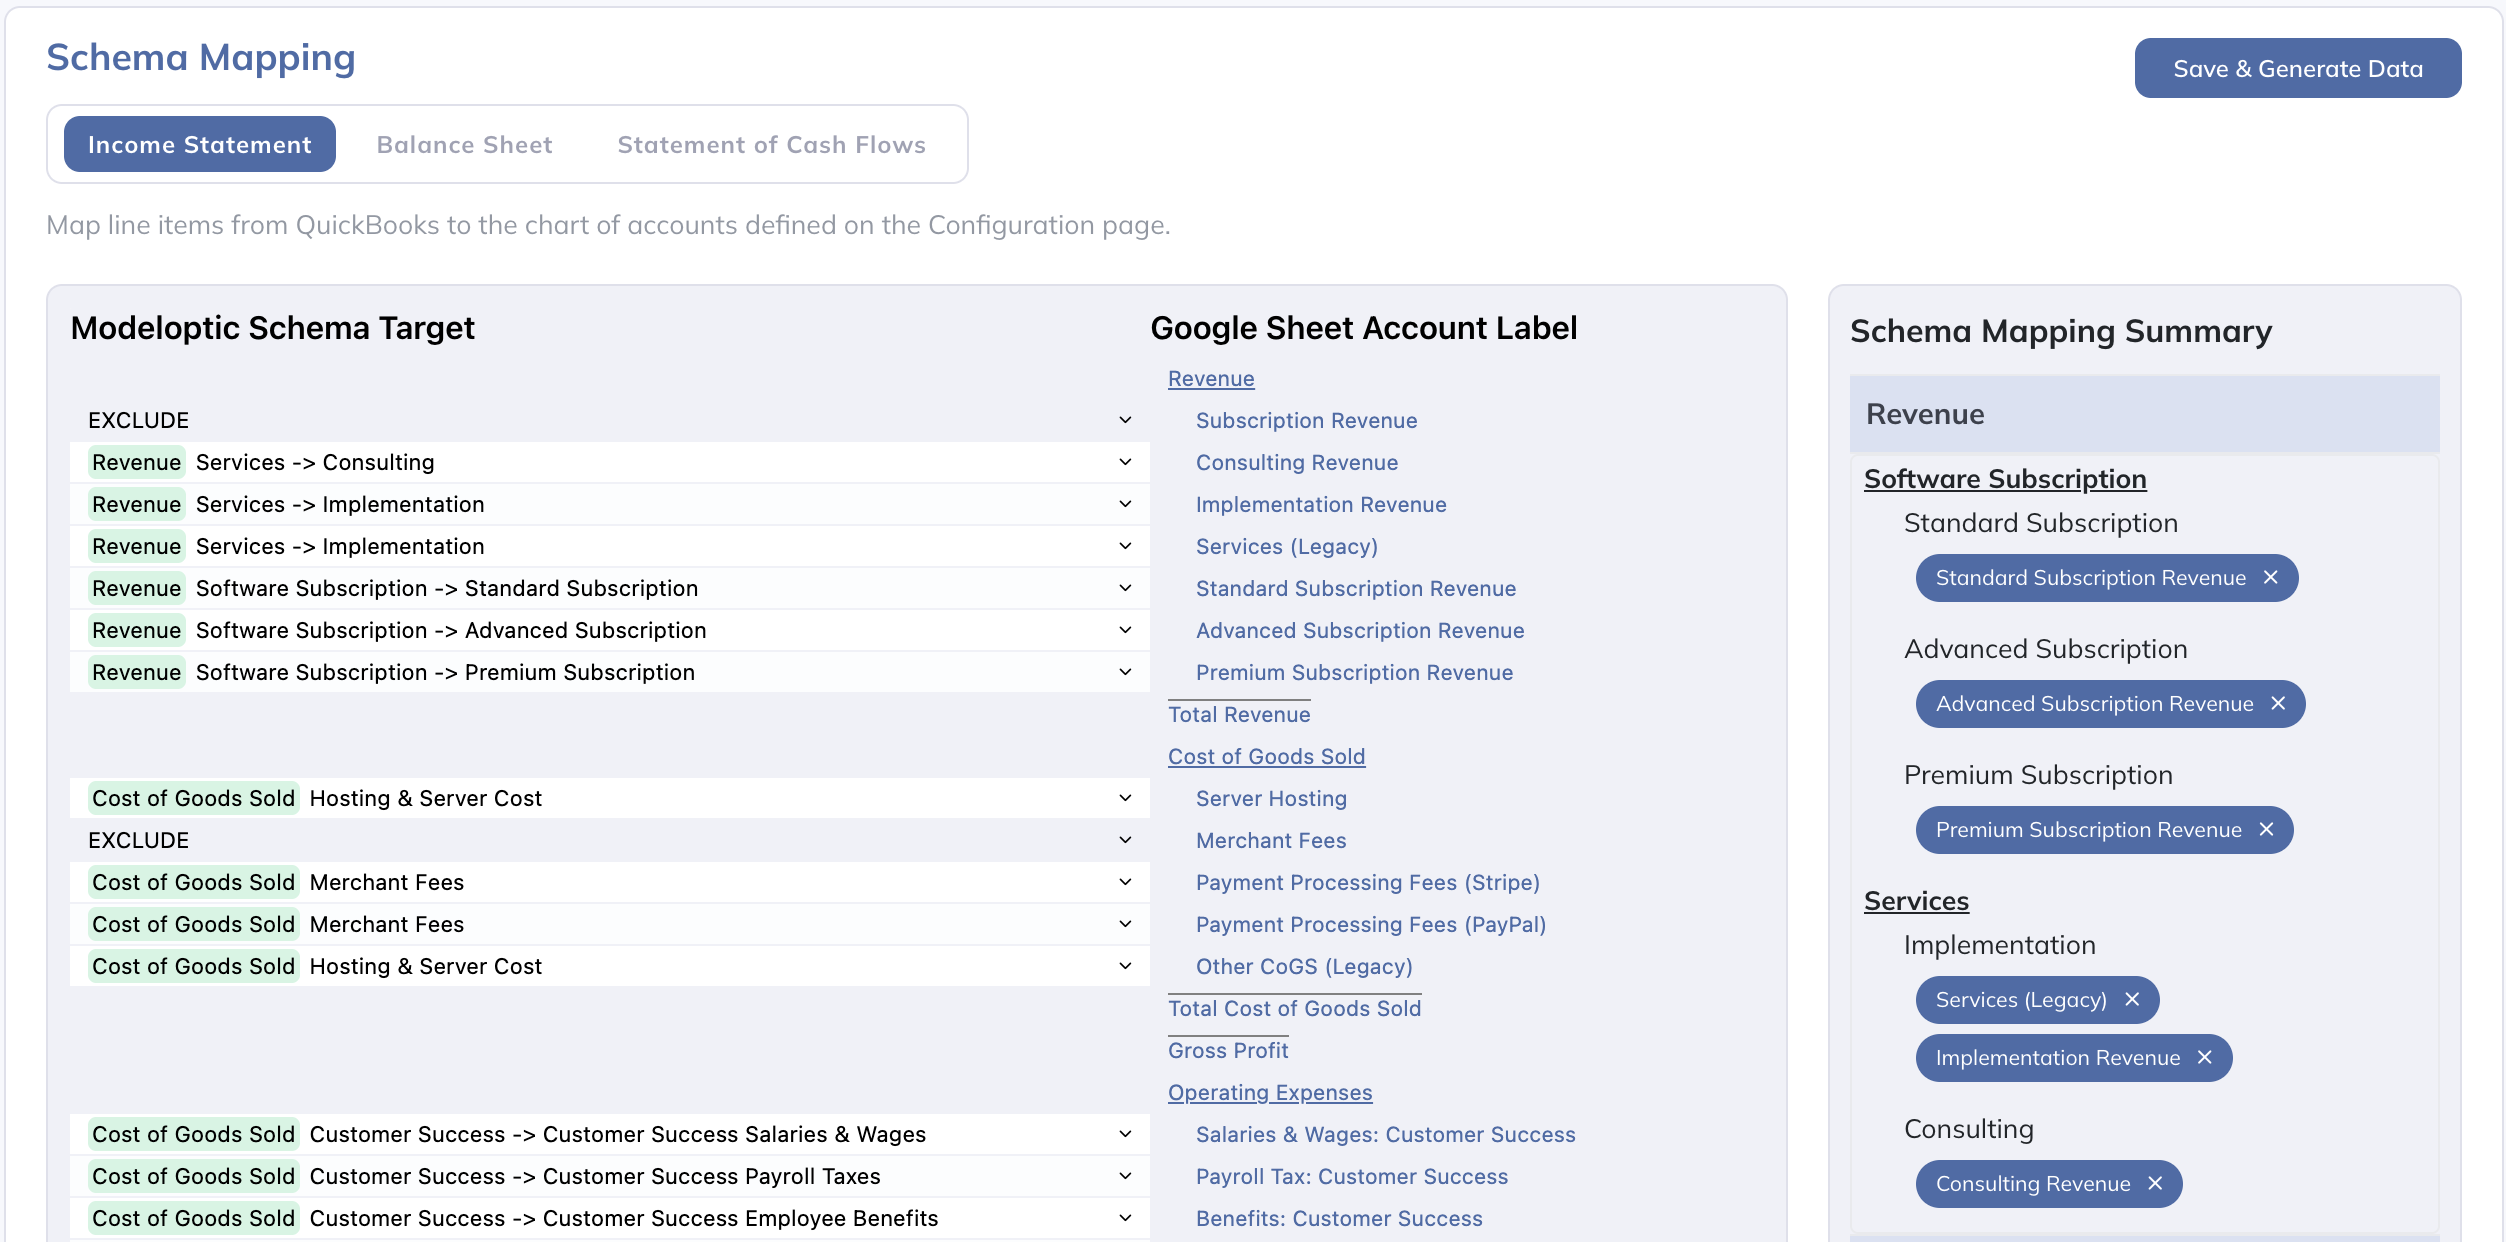
Once you've set up your chart of accounts within Modeloptic the way you'd like it for the sake of forecasting and reporting, you can update the mapping between the chart of accounts in your accounting system and your chart of accounts within Modeloptic on the Historical Data page, which looks as follows:
For more detail on how to modify your schema mapping, see the Schema Mapping section of the documention.
When you're ready to refresh your historical data within Modeloptic, navigate to the Historical Data page. Make sure your Latest Historical Period is set to the appropriate period, and click the Refresh button:
Once your refresh completes, make sure to map any new lines in your chart of accounts (if there are any), then hit the "Save & Generate Data" button.
For more detail on this process, see the Historical Data section of the documention.
There are three distinct pages within Modeloptic that specifically provide reporting capabilities:
-
Dashboard: This is where reports can be set up for use within the browser in a free-form manner.
-
Reports: This is where reports are structured within pages and can be compiled into deliverable documents that can be generated to PDF on demand.
-
Variance Analysis: While the above two pages provide variance capabilities as well, this page is specifically set up to facilitate in-depth variance analysis, including the ability to dig into transaction-level detail for any particular account.
On all of these pages, you can configure your reports to capture the specific nuances of your company.
By default, most reports are set up to automatically update when you roll forward your latest historical period. This can save you a ton of time versus needing to manually update all of the components of your report manually each month.
To learn more about each of these pages, see the following sections of our documentation:
There is a lot more to know, but this should be enough to get you started!
If you'd like to learn more about how Modeloptic works, feel free to take a look through our documentation.
If you have any questions for us, please feel free to contact us. We'd love to hear from you!