One of the core concepts underpinning how Modeloptic (and how financial modeling in general) works is the idea of a table. Modeloptic v2 gives you powerful tools for building, managing, and composing these tables.
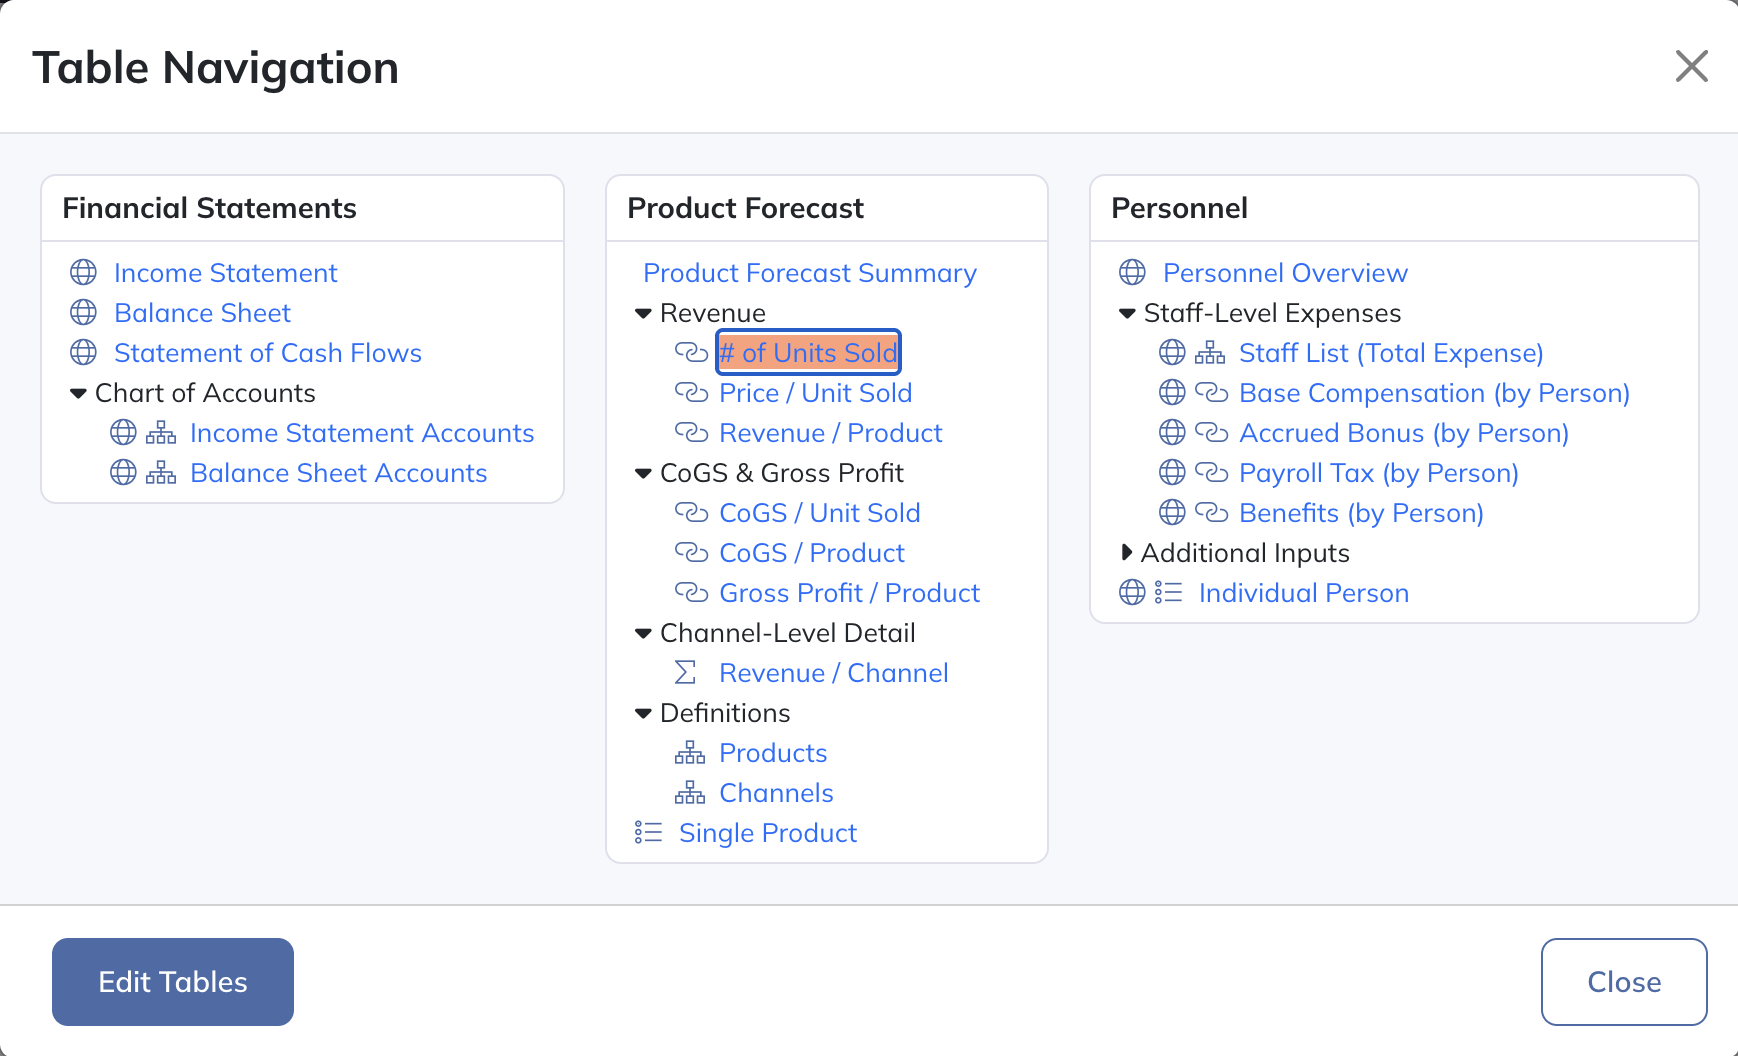
Beyond the financial statements (which are their own special type of table), Modeloptic now contains the following table types:
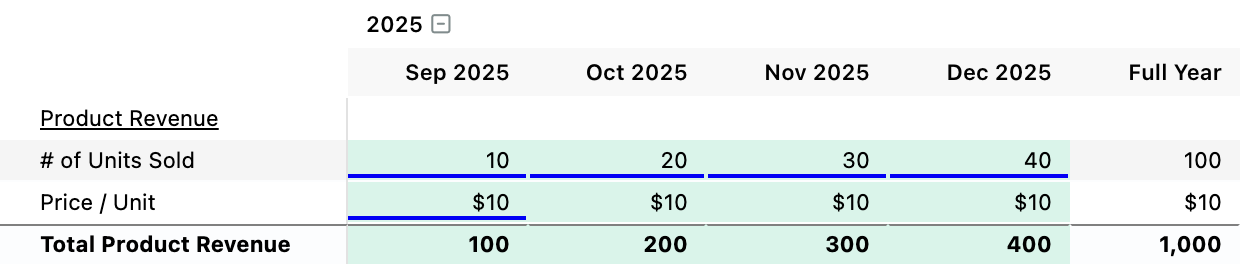
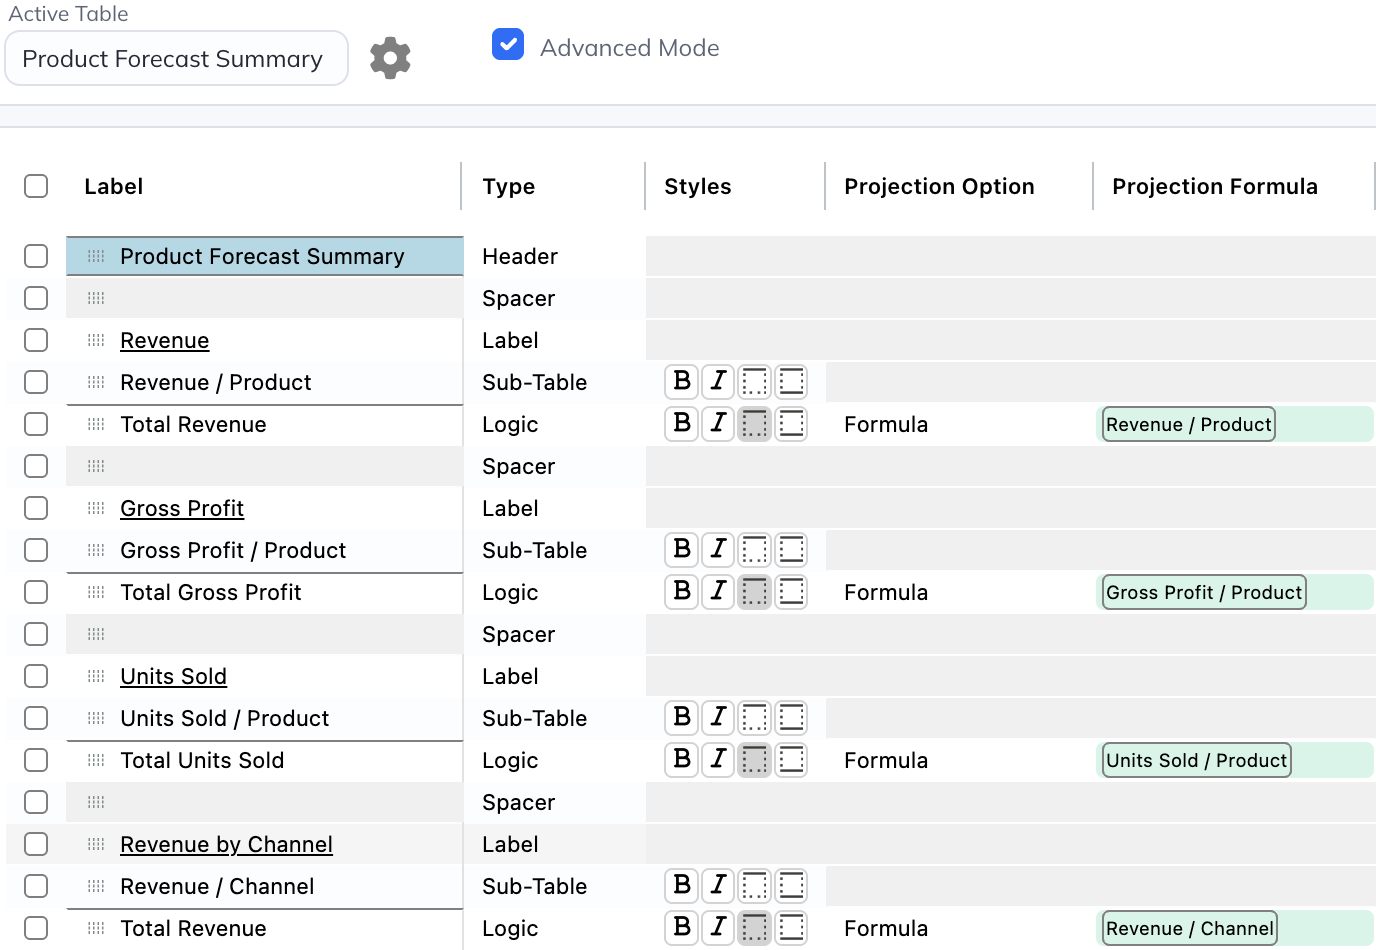
In a Free-Form table, you can add whatever rows you want, and link them together however you want. This is how forecasting is typically done in Excel (and if you're a current Modeloptic user, this is what you'd do in what was previously called a "Forecast Module").
If you have a simple forecast or otherwise prefer this mode of forecasting, you're free to stick to just Free-Form tables if you'd like. For anything beyond the basics though, utilizing the below table types where appropriate will generally be advantageous (like when you need to forecast sales for more than one product, for example).
These table types are used for forecasting a collection of similar items (like employees, customers, product SKUs, etc), and for operating on them as a group instead of as individual lines.
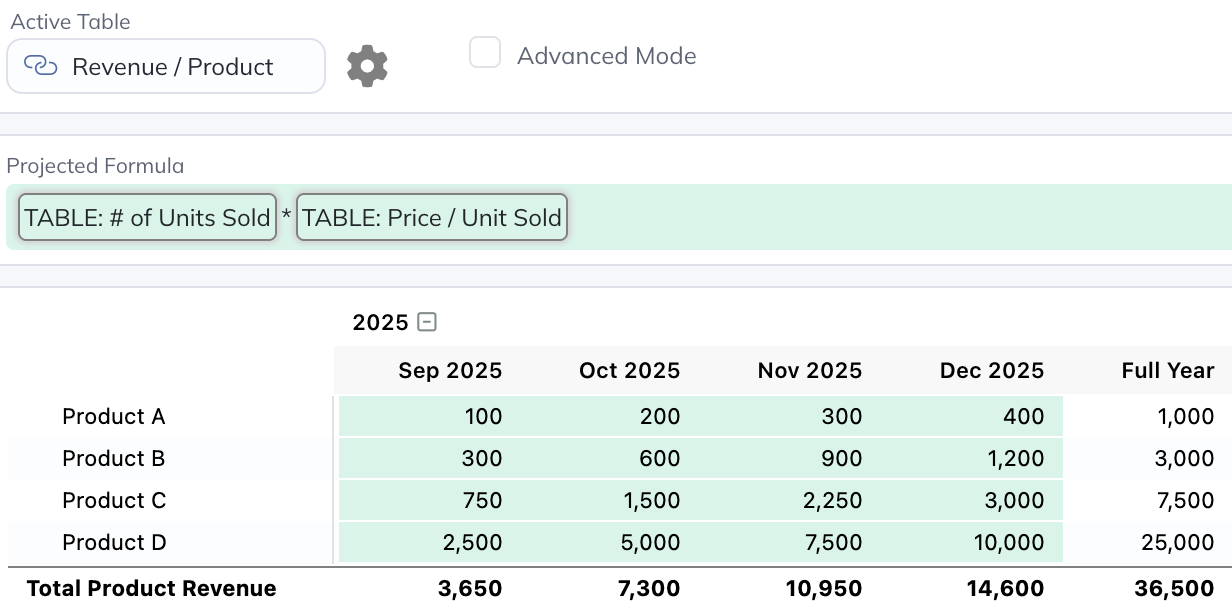
A One-to-One table functions like a Standard table, with the exception that you choose a parent Standard table to reference and the row structure in the One-to-One table will then mirror the structure of the target table. When rows are added, deleted, reordered, or renamed in a parent Standard table, the change is automatically reflected in all child One-to-One tables as well.
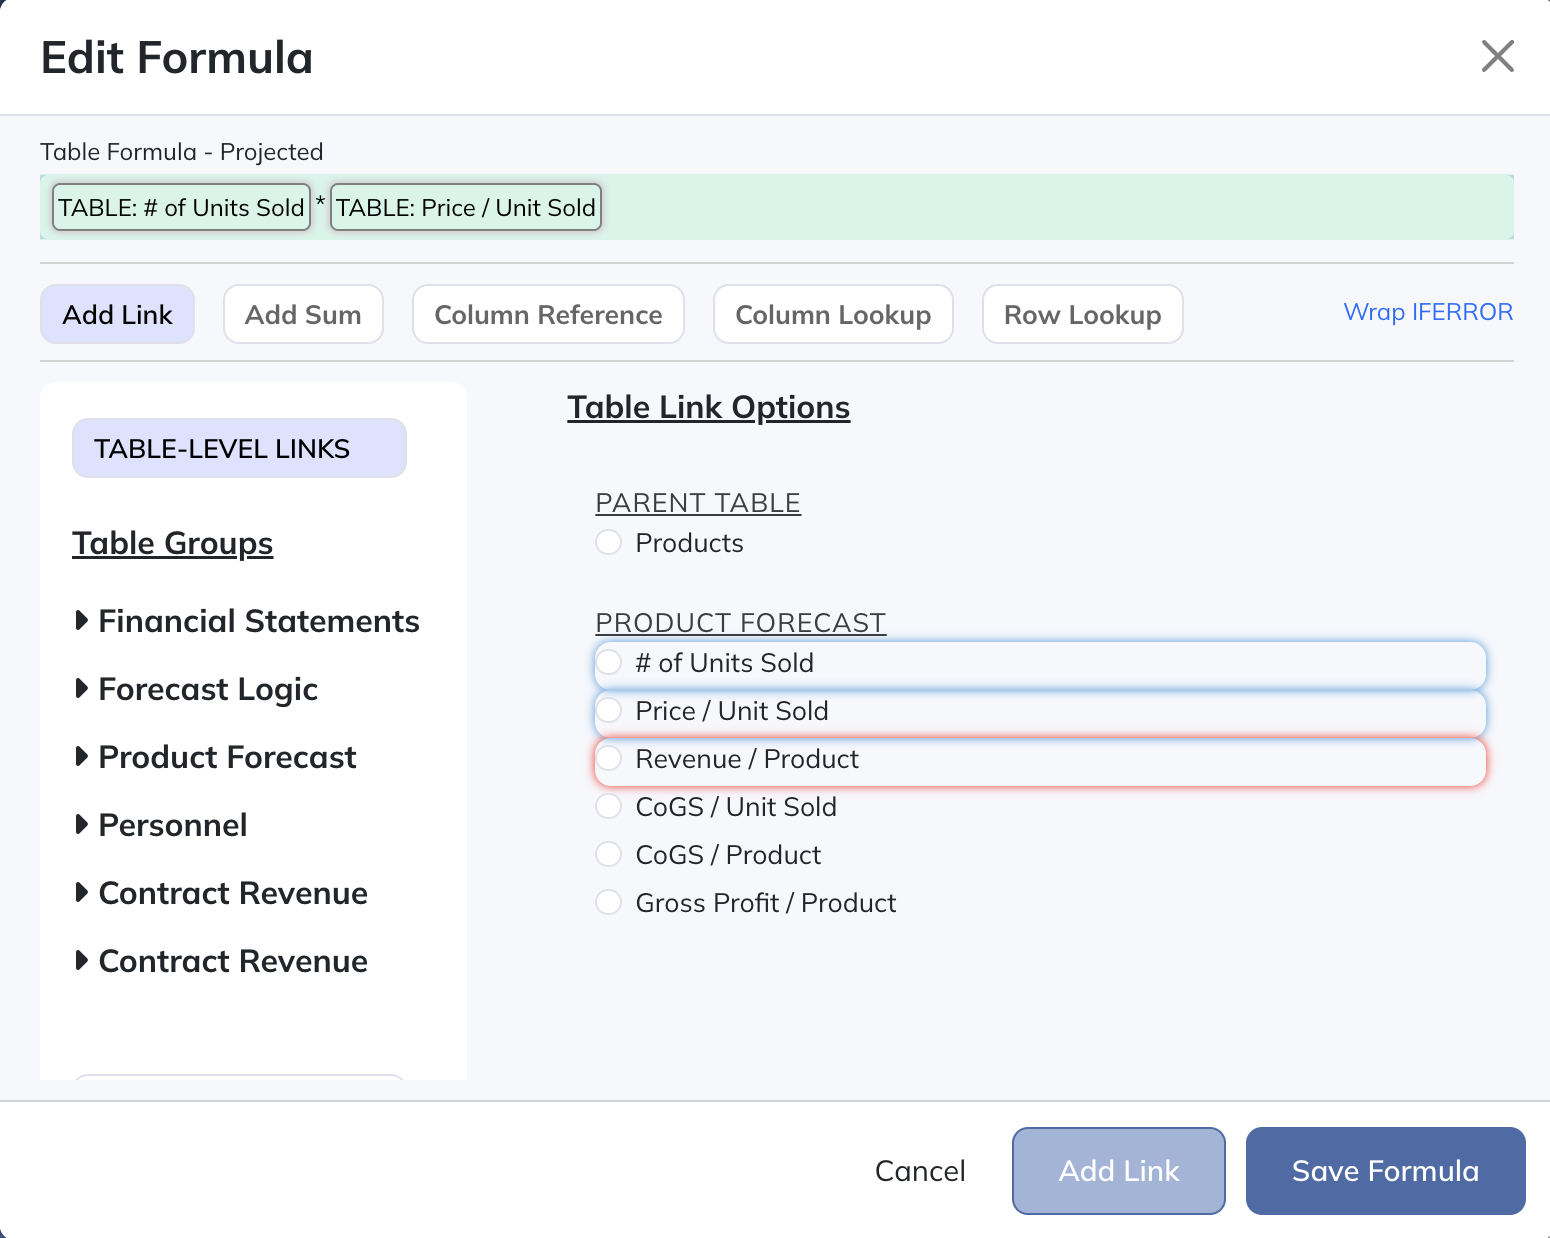
Having the ability to operate on a group of items in aggregate this way and to have them stay in sync automatically is a powerful capability that allows you to forecast at a much higher level of abstraction than you'd be able to otherwise.
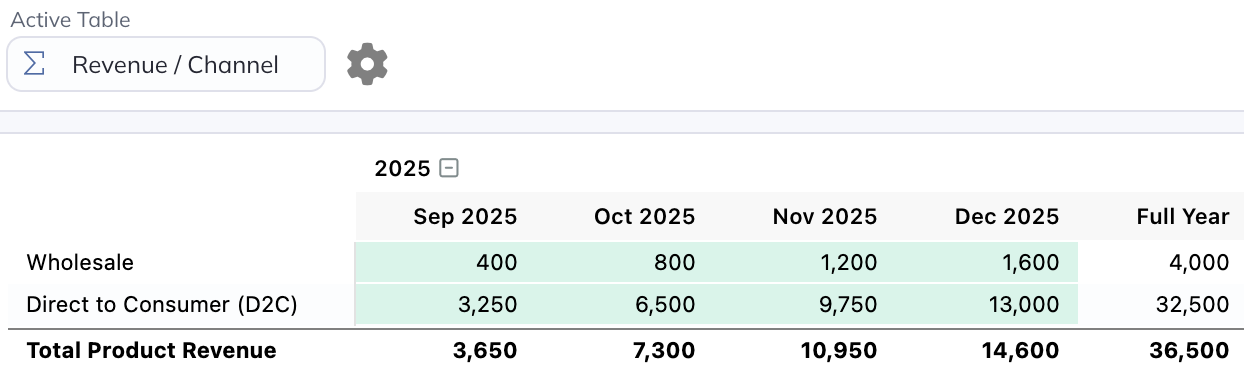
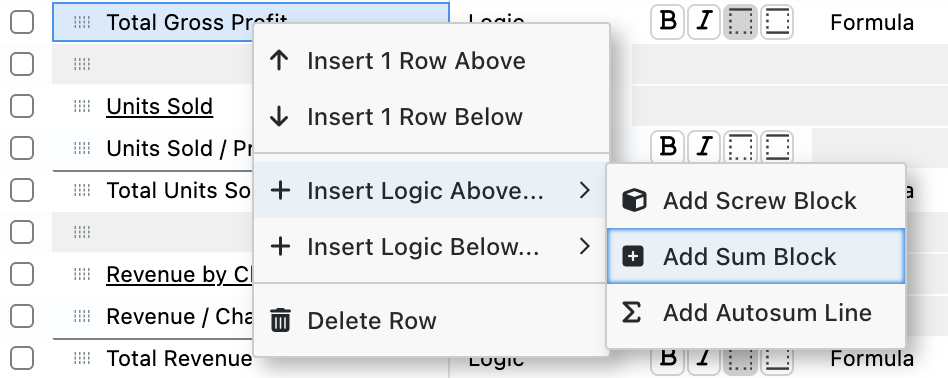
These are used for performing aggregations of items in another table, like aggregating product sales by channel.
If you have a Revenue by Product table that looks like the above, an analysis table that references it and aggregates on the "Channel" column would look like this:
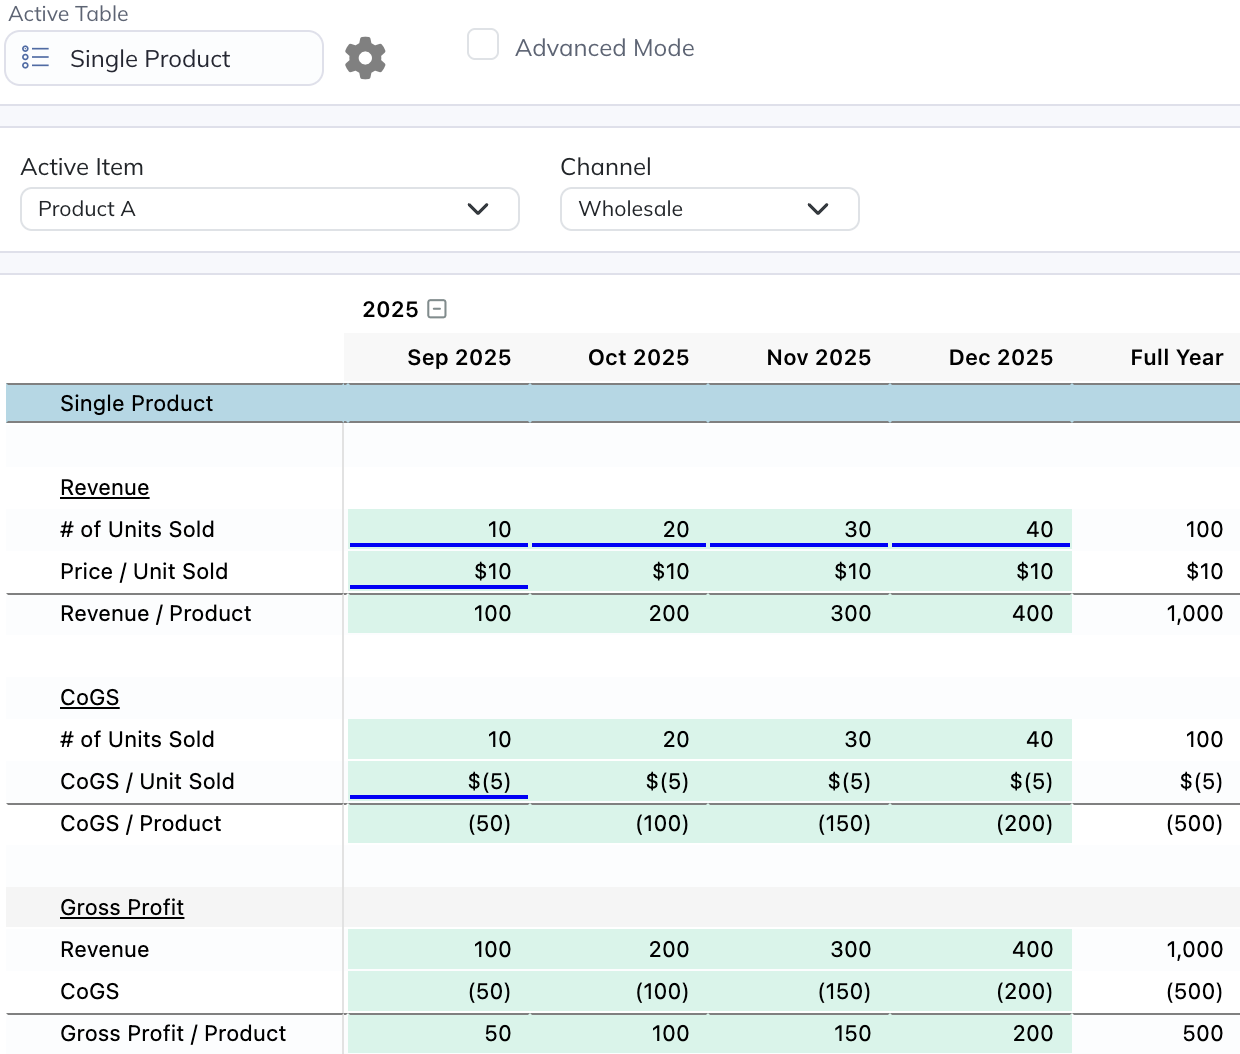
This is a special type of table that lets you scope to an individual item in a set of standard or one-to-one tables, like seeing the forecast detail for a single product:
These table types and the capabilities they afford let you operate at a much higher level when building and maintaining your model versus needing to manually edit every individual cell across multiple tabs like Excel requires. Unless you have an extremely simple model, Modeloptic becomes an invaluable tool for managing complexity.
For a more detailed example of how powerful these tables can be, see our walkthrough here.
For a more comprehensive run down on all of these new forecasting capabilities, see our documentation here.