
Getting Started
Overview
Modeloptic is a powerful and intuitive financial reporting and projections platform. It enables you to build a compelling forecast of your company's future, generate insightful financial reporting materials, and professionalize your strategic finance operations.
Modeloptic can be completely self-service, or you can leverage our team to help you build and maintain your financials on your behalf. It's possible to edit models using the Modeloptic UI, but most users choose to utilize Modeloptic's AI agent to make most edits on their behalf.
Free Trial
If you'd like to try out Modeloptic on your own using your company's own data, we have a free 14-day self-service trial available.
Once you create the connection to your accounting system, Modeloptic will auto-generate your chart of accounts and a basic starting forecast for you.
If you'd like a live walk through from us or have any questions, please feel free to Contact Us any time.
Demo
If you'd instead like to try out Modeloptic using an instance pre-populated with example data, we also have a self-service demo available.
Company & User Account Creation
The first step to getting started in Modeloptic is to Contact Us to choose a plan and have us create an account for your company.
We will also create user accounts for you and your team, and make sure the correct permissions are set on each. See the User Access & Permissions section for more detail.
Implementation
Getting your Modeloptic account set up and model built is typically a very quick process. It can be done in a matter of hours for companies with simple financials, or can take a bit longer for companies with more complex circumstances.
While Modeloptic can be set up completely on your own, many customers opt to have our team lead their implementation to ensure their configuration, forecast, and reporting materials are comprehensive and robust. Once finished, we then hand the reins over to you.
Implementation includes the following steps:
- Set up your company's chart of accounts within Modeloptic
- Load in your historical financial data (typically via API connection to your accounting system)
- Build the first version of your model, typically over a few iterations
- Make any additional Data Connections that might be useful for forecasting or reporting (through a Google Sheets connection, an Excel Upload, or a Custom Integration)
- Customize your reporting setup to ensure it's capturing the key nuances of your business
- Hold an onboarding training session to bring your team up to speed
All of these steps are covered in detail in this guide.
Signing In
Once your account has been created, you can log in here, or by going to the "Login" link on Modeloptic's main page.
Navigation
Once logged in, you will start on the Model page. The Model page is the central hub for building and managing your forecast, and contains several tabs across the top of the screen:

- Model: The primary view for creating and modifying your forecast, as well as where you can view your full financial statements.
- Transaction: Build and review corporate transactions attached to a Projection Set. Appears when Corporate Transactions are enabled in Configuration.
- DCF: Build and review discounted cash flow valuations. Appears when DCF Valuations are enabled in Configuration.
- Projection Sets: Create and manage different versions of your model.
- Historical Data: Refresh your historical data within Modeloptic (either from your accounting system or via Excel or Google Sheets) and update the mapping between the chart of accounts in your accounting system and the chart of accounts in Modeloptic.
- Configuration: Edit key company settings, including the start date for historical data, end date for the projected period, and your chart of accounts.
To navigate to other pages within Modeloptic, use the menu icon in the top navigation bar. This will present the following options:
- Dashboard: View and customize graphs, Data Tables, and more to get insights into company performance. This page is structured in a free-form format, intended for use within the browser.
- Reports: Similar to the Dashboard page, but structured into pages intended for creating deliverable reports in PDF format.
- Variance Analysis: A powerful tool for measuring actual performance versus prior forecasts (or actuals vs prior actuals).
- User Activity: View an activity log for users with access to your instance.
- User Management: Add and edit user access permissions for all users within your instance.
- Company Selection Lobby: If you have access to multiple companies within Modeloptic, you can switch between them here.
- User Account: See basic information about your user account and change your password when desired.
Company Configuration
Most of your company's configuration will be set on the Configuration tab:
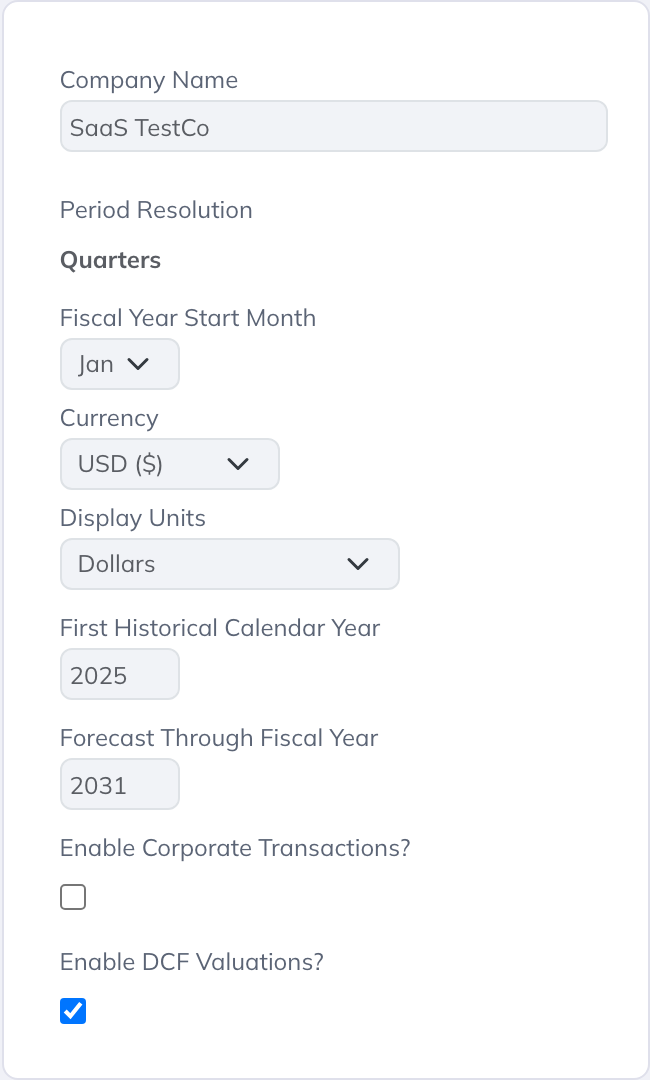
There, you will see options for setting:
- Your Company name
- Your Company's fiscal year start month
- Which historical and projected years to include
- Your Company's chart of accounts within Modeloptic
Each of these is covered in more depth in the Company Configuration section of this guide.
Loading in Historical Data
The next step will be to load in your company's historical financials and operating metrics.




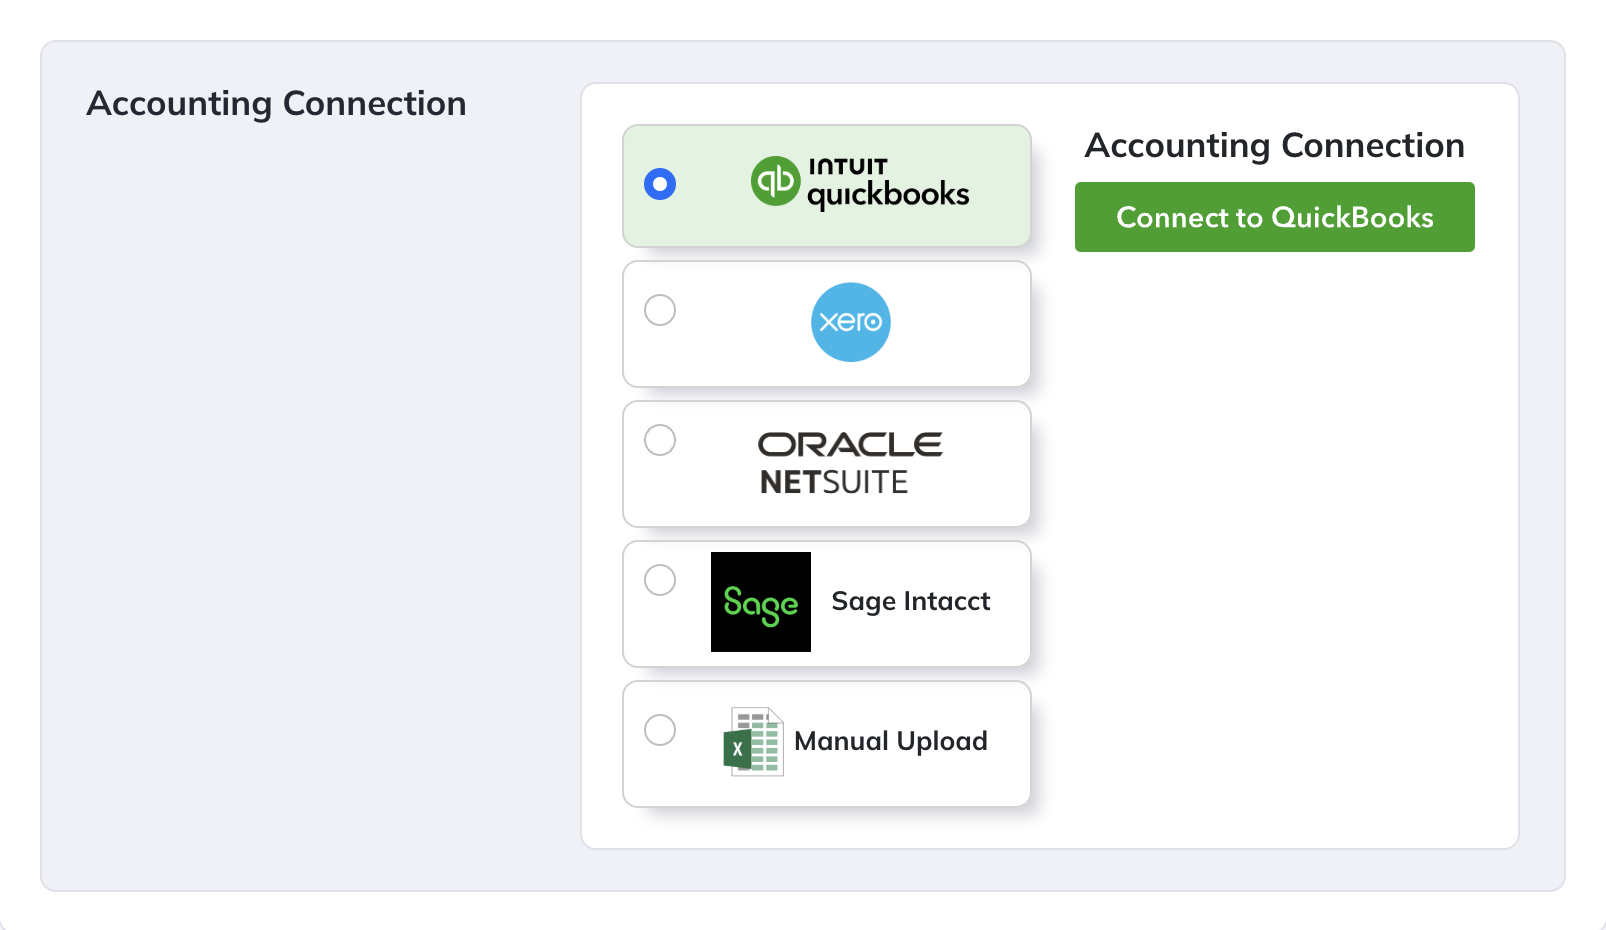
If you use QuickBooks, Xero, NetSuite, or Sage Intacct for your accounting, you can create a direct connection to pull data from them into Modeloptic. Otherwise, accounting data can be loaded in via Excel upload or a Google Sheets connection. Setting up your accounting connection is done entirely on the Historical Data tab, and can be refreshed on demand if you wish to reflect any recent changes in your accounting detail.
You'll also be able to set up any external Data Connections on the Historical Data tab to inform your reporting and forecasting. All of this is covered in detail in the Historical Data section of this guide.
Creating Your First Model
To build with AI, open the Agent panel on the Model page, attach your source files, and describe the model you want. Follow the Modeloptic AI Agent guide to review, preview, and apply its changes. The steps below explain how to create and edit a model manually.
Once your company configuration has been set and historical data has been loaded in, switch to the Projection Sets tab. Create your first blank Projection Set using the "+ Create New Blank Projection Set" button in the bottom right, give it a name, and hit the "Save Data" button in the top right.
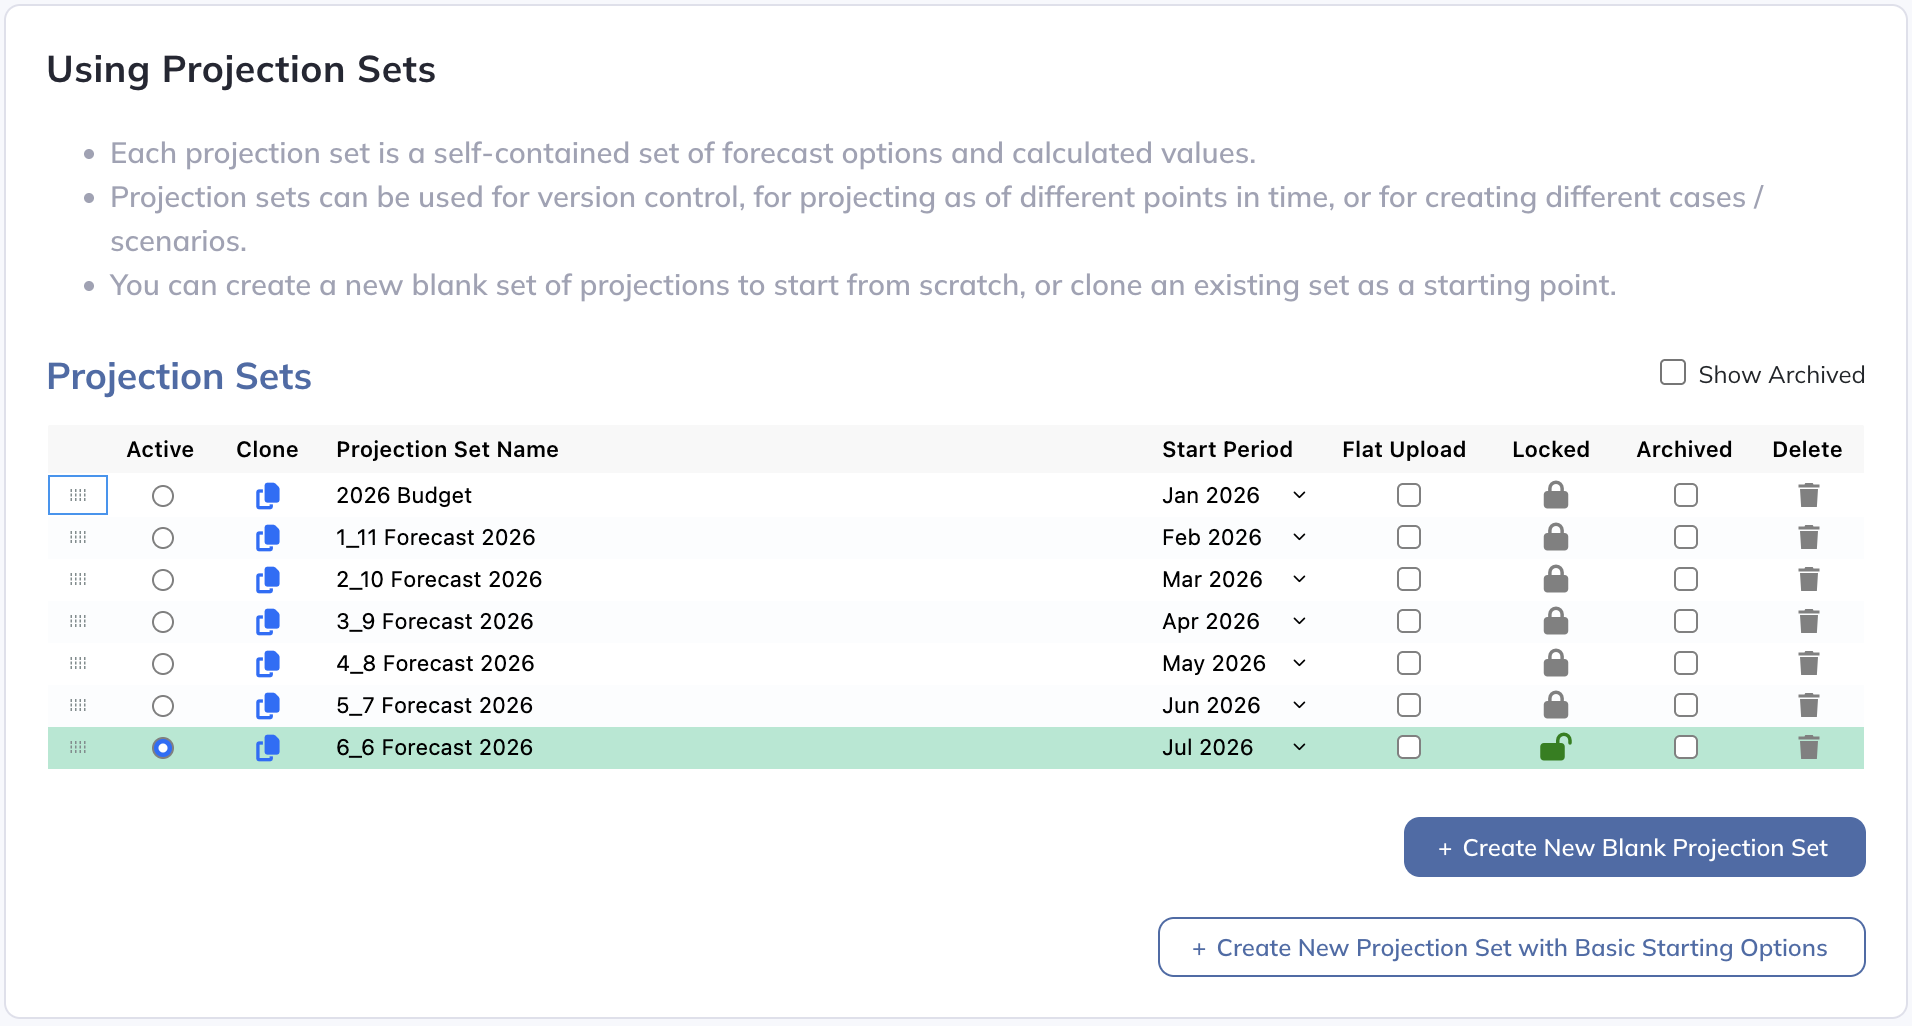
Build and edit your forecast on the Model tab. The Model Structure & Navigation section explains how Logic Rows, Views, and Collection Tables fit together.
To open Model Navigation, click the current View or Collection Table name in the top left, or press q while no text field is focused:

This will open up a screen that looks like this:
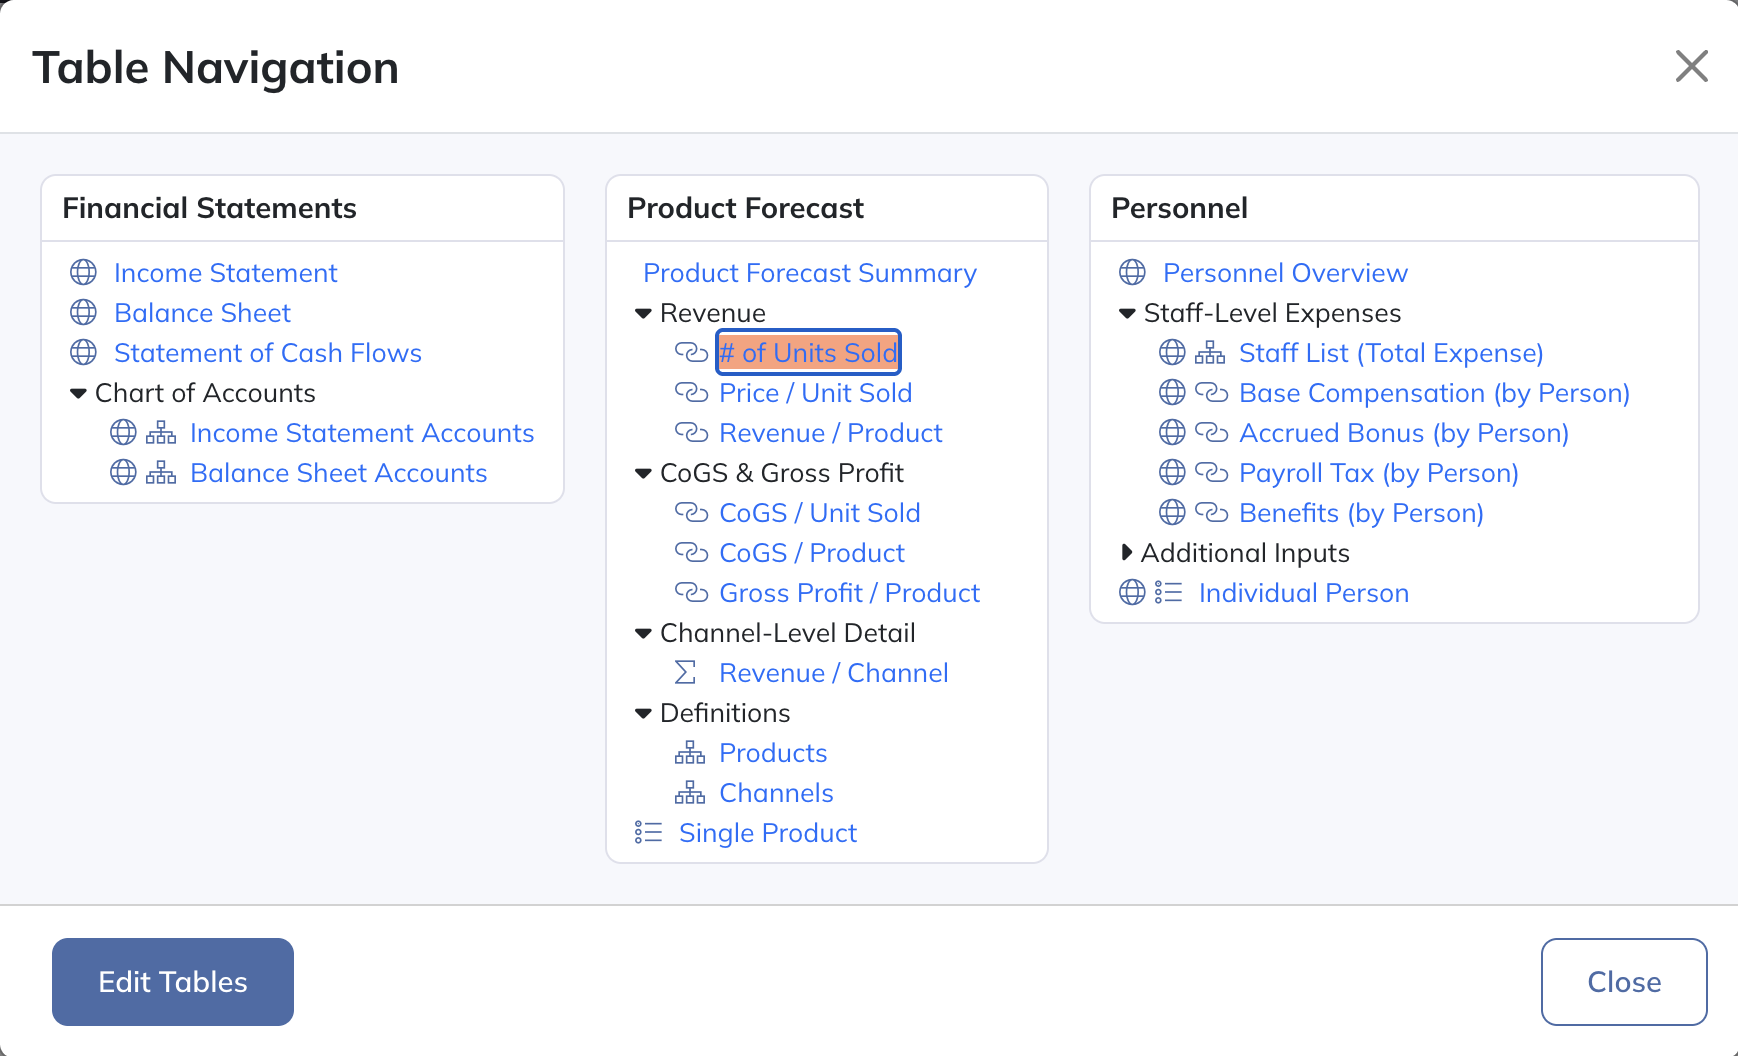
Use Model Navigation to open financial statements, Views, Collection Tables, and Logic Row Groups. Click a name or navigate with the arrow keys.
On the top right of each page, when errors are present, you'll notice an error icon that looks like this:

This indicates that there is a validation error in your model. This isn't surprising if you have a newly created blank model, as the validator will be telling you that you need to set forecast options on all of your line items. Clicking on it will show you the errors:
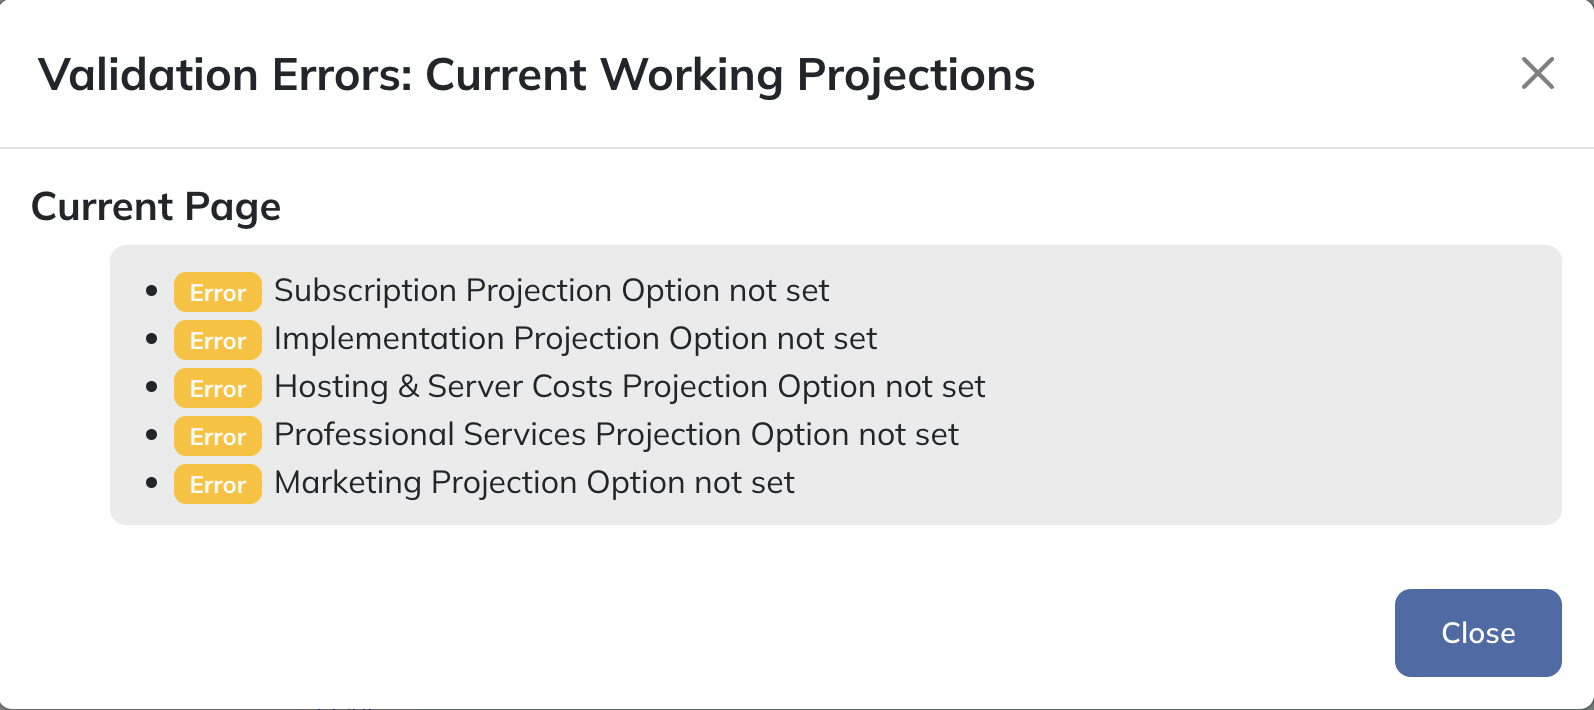
Most entries on this screen are clickable and will navigate the page to the location of the error. As you go through each line and begin setting forecast options, these errors will go away. Detailed instructions on how to create projections can be found starting in the Forecasting Fundamentals section of this guide.
Period Views
Your company’s Period Resolution (Months, Quarters, or Years) is chosen when the company is created. Forecast inputs are entered at that resolution. The period selector changes how those inputs are displayed and aggregated.
| Period Resolution | Available displays | Enter hardcodes in |
|---|---|---|
| Monthly | Months, Quarters, Years | Months |
| Quarterly | Quarters, Years | Quarters |
| Annual | Years; no selector needed | Years |
Formulas can still be edited while viewing aggregated periods. To edit hardcodes and other period-specific inputs, return to the Period Resolution. Expanding a year shows its component months or quarters; collapsing it shows the year total. Offsets and trailing-period choices also follow the Period Resolution.

Getting Assistance
If you ever want help with anything related to Modeloptic, or corporate finance in general for that matter, our team is always here to help.
Technical support, including walkthroughs of Modeloptic functionality, is always free for customers. If you need more intensive help, contact us to discuss your requirements.