
Historical Data: Financials
Overview
The Historical Data tab contains everything related to your company's historical accounting data and any other key metric data you choose to import into Modeloptic. When you open the Historical Data tab, you'll see a display that looks something like this:
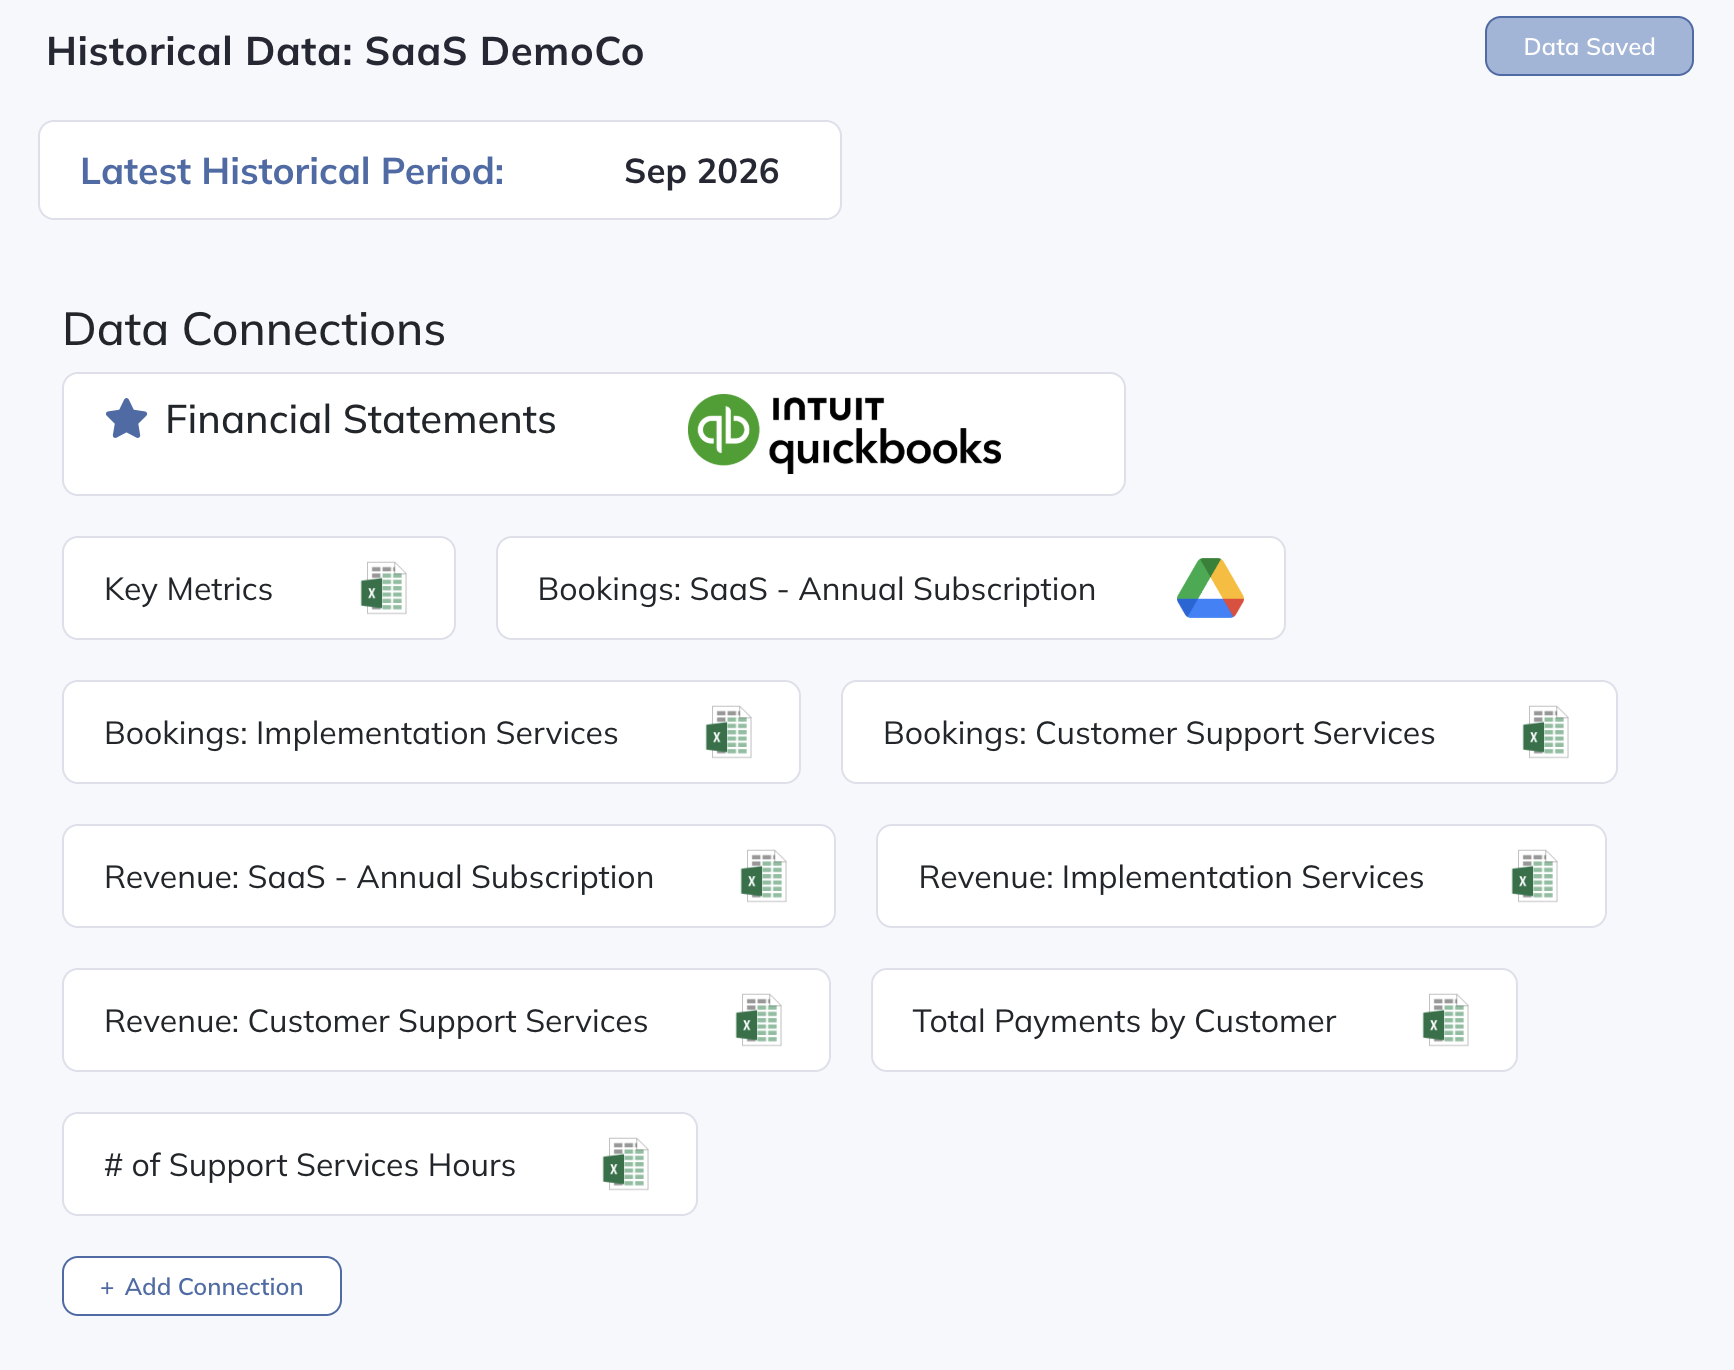
All of your Data Connections will be displayed here, starting with your Accounting Connection at the top of the list. This data connection will link to your accounting system and will pull in your Income Statement, Balance Sheet, and Statement of Cash Flows historical data.
To add new Data Connections, scroll to the bottom of the page where you'll see a button below the Data Connections list that looks like this:

Further Explanation on how to configure additional Data Connections can be found in the Additional Data Connections section of this guide.
Latest Historical Period
Set the Latest Historical Period to the last period of actuals you have loaded. Click the pencil icon to choose the year and the month, quarter, or year, following the company’s Period Resolution. Projections begin in the following period:

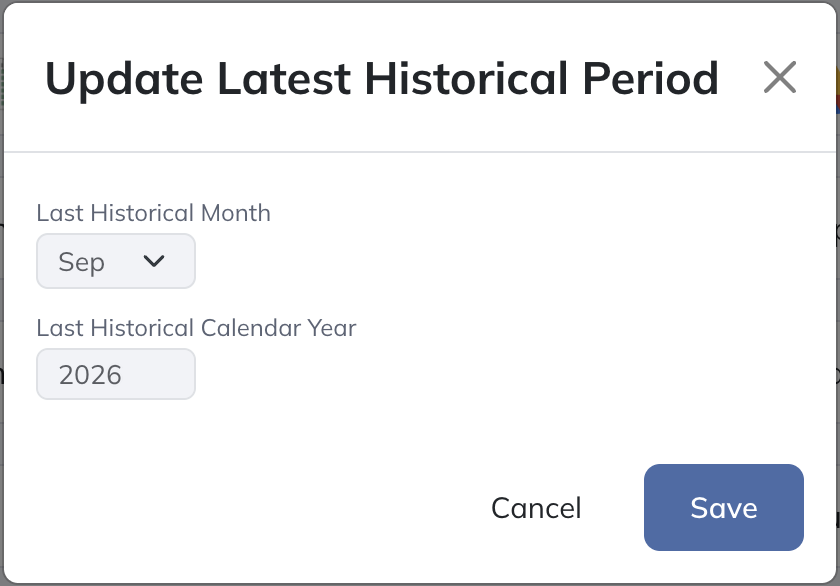
When you're updating your model with the latest actuals each month, be sure to first update the latest historical period before refreshing.
Accounting Integrations
As mentioned above, you can load data into Modeloptic through an API connection to your accounting system, through an Excel Upload, or through a Google Sheets connection.




We currently have direct API connections with QuickBooks, Xero, NetSuite, and Sage Intacct.
To connect Modeloptic to your Accounting System, select the Financial Statements Data Connection on the Historical Data tab and you will see the following options:
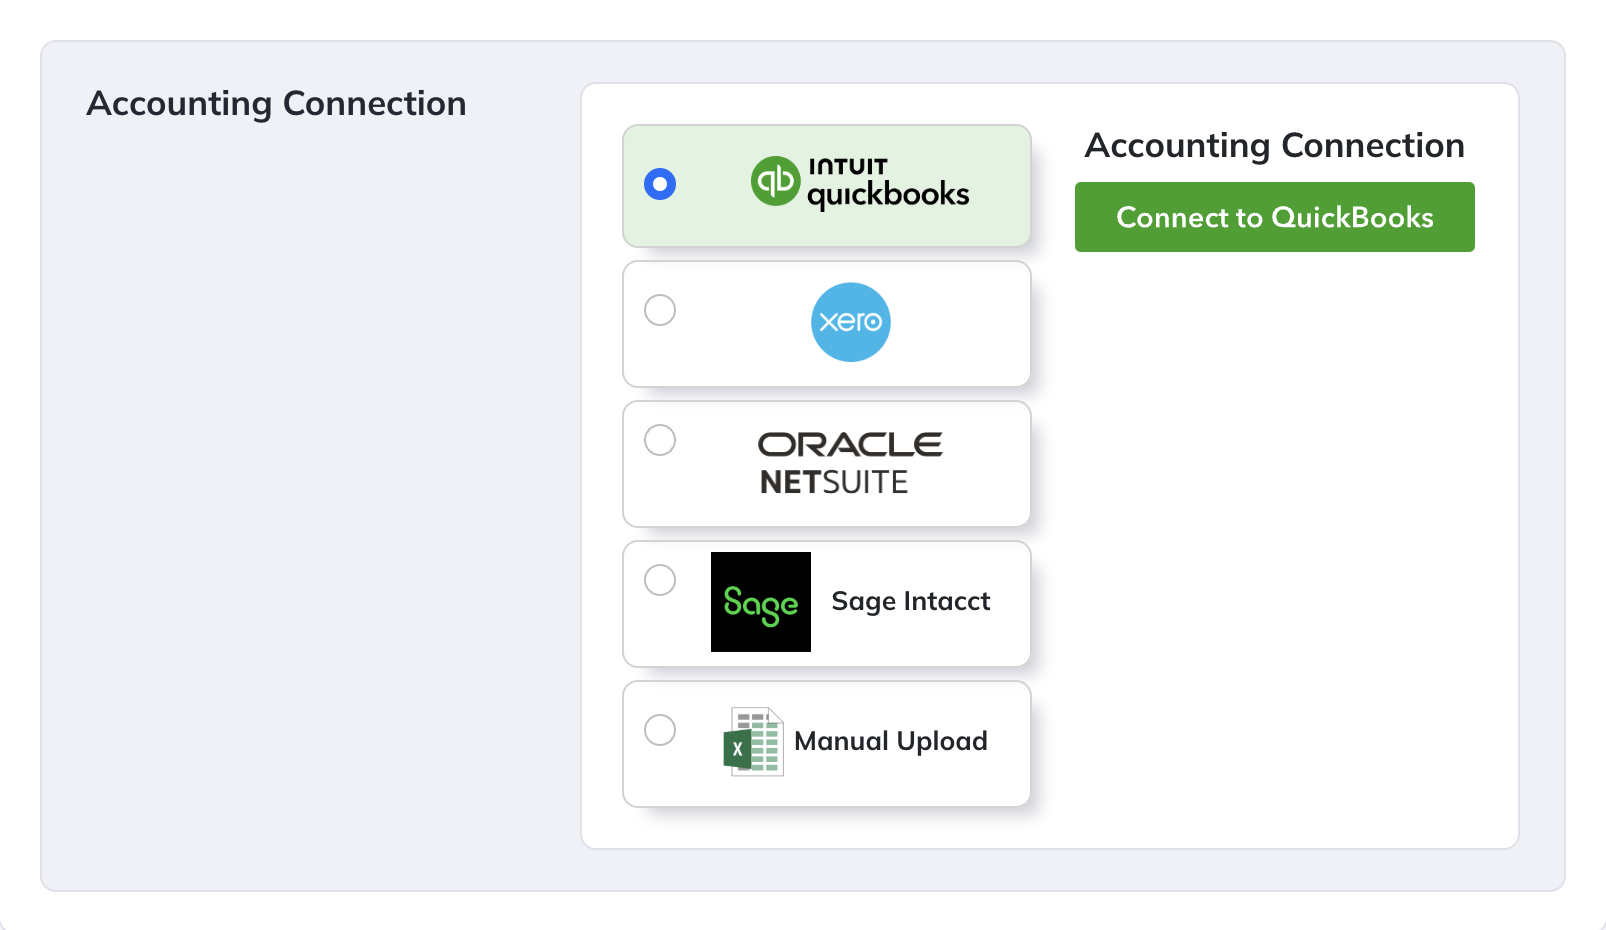
If you select either the "Connect to QuickBooks" or "Connect to Xero" options, you will either see confirmation that your account has been connected, or if you're visiting for the first time, you will see a button that will allow you to create a connection:


Either of these buttons will prompt you to log into your accounting system and authorize Modeloptic to retrieve your historical financial data.
If you use NetSuite for your accounting system, click here for instructions on how to set up your NetSuite connection.
If you use Sage Intacct for your accounting system, click here for instructions on how to set up your Intacct connection.
Currency Conversion
You can also apply a currency conversion to the data being pulled into Modeloptic through your accounting system (or from Excel or Google Sheets) so that you can forecast in an alternate currency by selecting the checkbox next to "Apply Currency Conversion?" on the Financial Statements Connection Settings menu.
If this option is selected, a Currency Conversion Rates section will appear below the Financial Statements Connection Settings menu & will look something like this:

Enter the historical conversion rates into this section and your accounting data will be converted into your desired currency.
Excel Upload
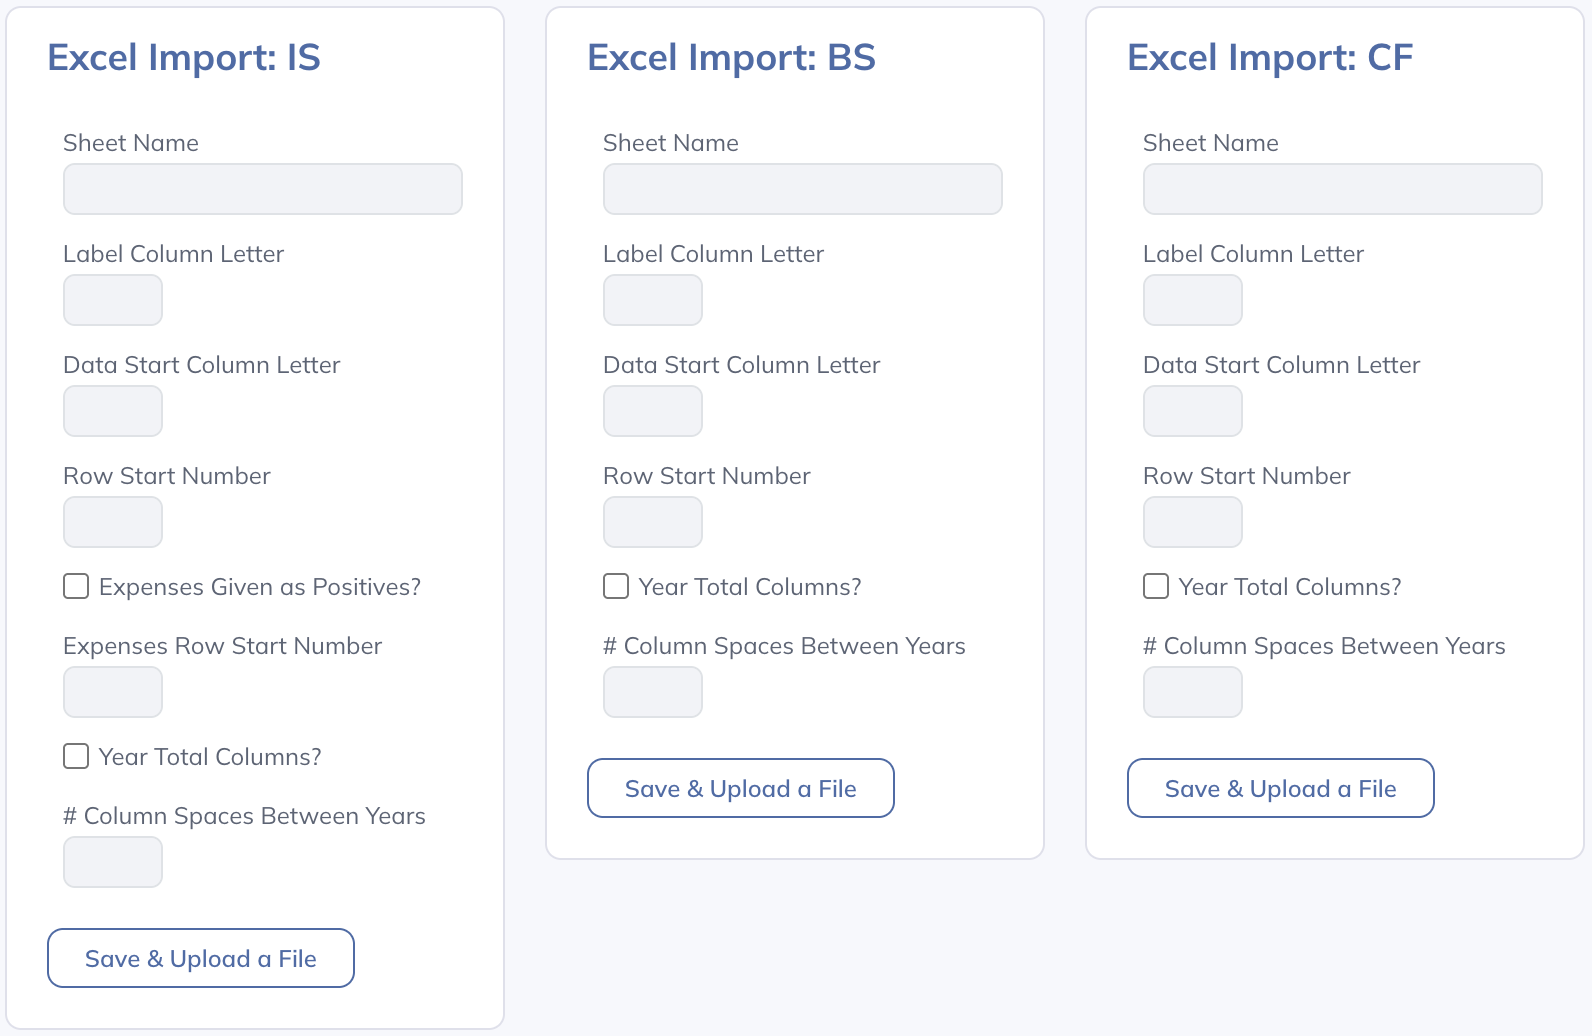
If you've chosen to upload your financial data from Excel, select the "Excel Upload" option in the Financial Statements Connection Settings menu. Making this selection will display the following off to the right-hand side of the Financial Statements Connection Settings menu:
To seamlessly pull data from the file you're uploading, it should be organized like this:
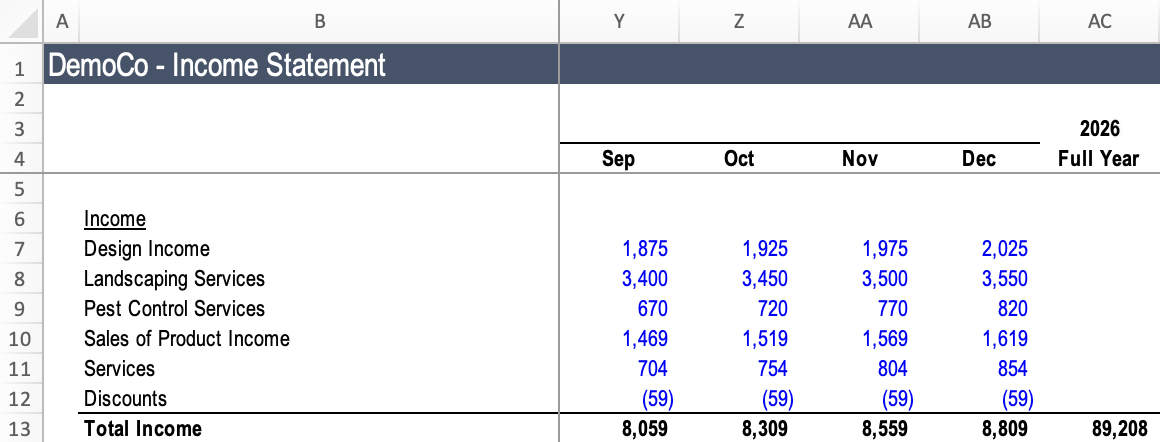
Use one sheet per financial statement and one column per period at the company’s Period Resolution: month, quarter, or year. Keep periods in consecutive columns within each year, with the most recent period on the right. The example above uses monthly columns; quarterly and annual models need quarterly and annual columns instead.
When your data is organized and ready to be uploaded, set the import options for each of the three statements to correspond with the file that you're uploading. The options to set here are as follows:
- Sheet Name: The name of the sheet in the file you're uploading that should be imported for the given financial statement.
- Label Column Letter: The letter of the column that contains the labels for each line item.
- Data Start Column Letter: The letter of the column where the numerical data begins. Align this column with the first historical period included in the import. Use the company’s Period Resolution: month, quarter, or year.
- Row Start Number: The row number where you would like the import to begin (you'll presumably want to exclude header rows).
- Expenses Given as Positives?: By convention, Modeloptic displays expenses as negative numbers. If the expenses shown in the file you're uploading are positive, check this box to reverse their signs (Income Statement only).
- Expenses Row Start Number: The row on which the expenses begin (only applicable for the income statement). If you've checked the "Expenses Given as Positives?" box, values from this line forward will have their signs flipped.
- Year Total Columns?: Check this box if you have year-total columns between your period data columns. Leave this unchecked when each data column already represents a full year.
- Col Spaces Between Years: Indicate the number of blank columns that appear between each year of data (enter 0 if there are no such columns).
Once you upload a file, you should see a success message. After loading in data for all three financial statements, you're ready to move on to the next step (see the Mapping Your Data section below).
Google Sheets
If you'd like to use Google Sheets to load in your financial data, select the "Google Sheets" option in the Financial Statements Connection Settings menu:
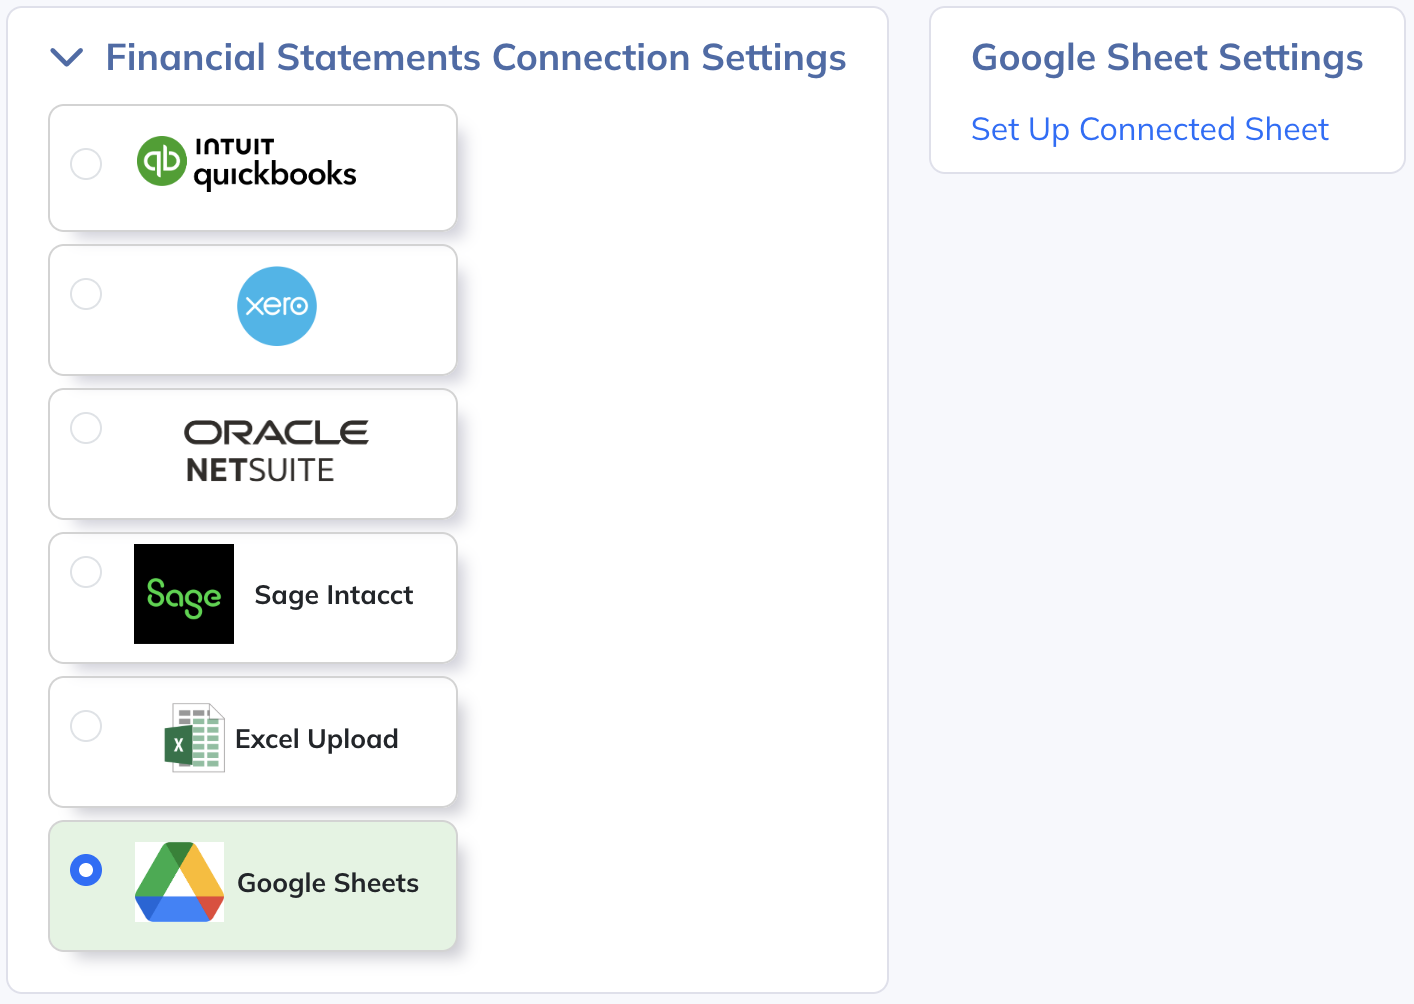
Then click the "Set Up Connected Sheet" button to create a new Google Sheet that will be linked to this Data Connection, and then click "View Connected Sheet" to open it. Anyone with access to your instance that has Historical Data permissions will then be able to access that Google Sheet to input data that'll be fed into Modeloptic. Note that the Google Sheet will be shared with the email address that's used to log into Modeloptic, so you'll need a Google account associated with that email address if you don't already have one.
Once you've entered data into your Google Sheet, click the "Retrieve Latest Data" button to pull the current values from the Google Sheet into Modeloptic. Below, you'll then see the "Data Mappings" section where you can create a mapping between the lines in your Google Sheet and the lines in the target Table in Modeloptic.
Refreshing Your Financials
Once you've set the latest historical period and linked your Accounting System, clicking the Refresh Data button inside the Data Refresh menu within the Accounting Data Connection will start the process of importing data from your accounting system into Modeloptic.
The accounting refresh process typically takes from a few seconds to several minutes, depending on how complex your financials are and how many periods you've chosen to import. You will see an alert when the process has finished. Imported values and transactions are stored in the Display Units set on the Configuration tab, so if you change that setting you'll need to refresh your accounting data again.
To refresh your Excel and Google Sheets Data Connections, you'll need to either upload an Excel file with new data or update the linked Google Sheet with updated data and then Retrieve the Latest Data from your Google Sheet.
Note that if you are using an Excel Connection, the Excel Import menu will have a link at the bottom titled "Re-download file" that will allow you to download the last uploaded file to your computer. This enables easy updates to the source data and will streamline the update process, so you don't have to dig through your files to find the original that you uploaded.
Any Connection that is referencing another connection will update automatically when the original Data Connection is updated.
Mapping Your Data
Companies will often have a higher level chart of accounts for the sake of forecasting and reporting versus a lower level chart of accounts within their accounting system. For example, in your accounting system, you might have lines for "Taxis", "Flights", and "Hotels", but in Modeloptic you might only want a single "Travel" line.
Schema Mapping connects your accounting chart of accounts to your Modeloptic chart of accounts. Additional Data Connections use Data Mappings to connect source lines to eligible Logic Rows or Collection Table rows. Below is an example of the financial-statement Schema Mapping section:
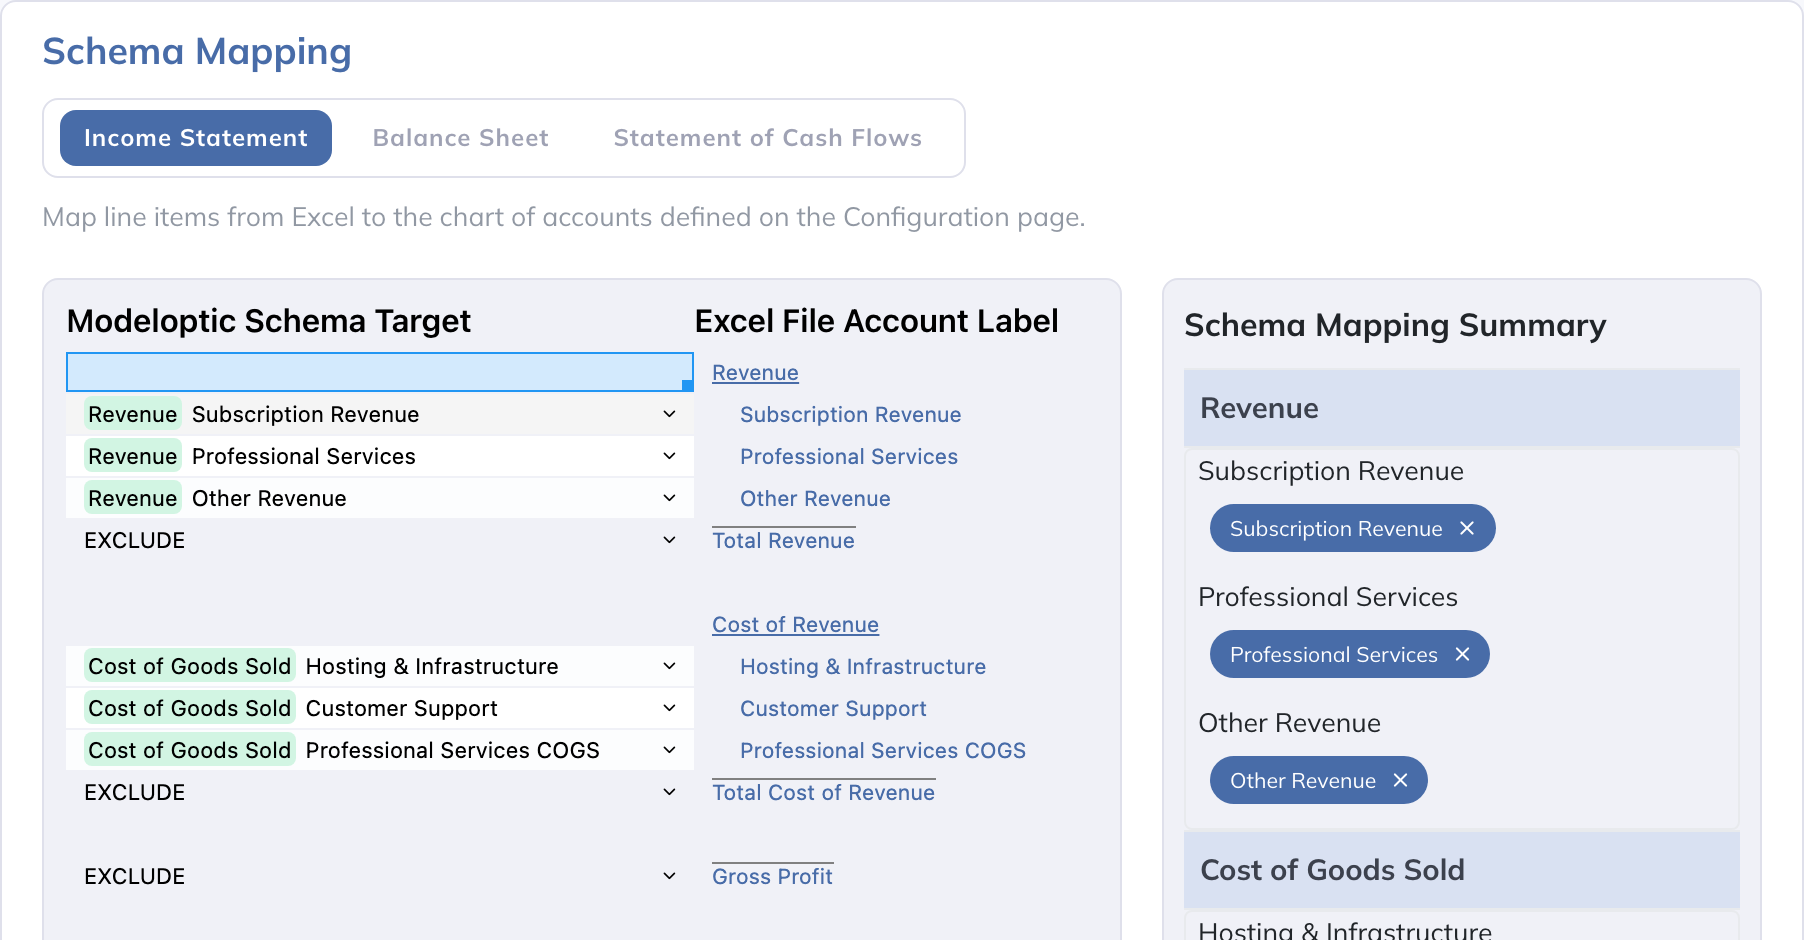
The target column contains the Modeloptic accounts; the source column contains the accounts from your connection. Assign source accounts to their corresponding targets. The separate mapping summary shows coverage and remaining unmapped accounts.
Use each target dropdown to assign the source account on that row. You can map several source accounts to one Modeloptic account. Open source-value detail to inspect the values being mapped, then save and review validation.
As a best practice, we recommend mapping all of the accounts on your financial statements, even ones that are empty at the moment. Note that for some accounting systems, account headers can also contain transactions, so be sure to map those as well.
You'll only need to set these mappings once during implementation, and those relationships will persist thereafter. You'll typically only need to revisit your mapping if new accounts are added to the chart of accounts in your accounting system, or if you wish to change how your Modeloptic account is structured.
The Additional Data Connection Data Mappings menu functions very similarly to the Accounting System Schema Mapper:
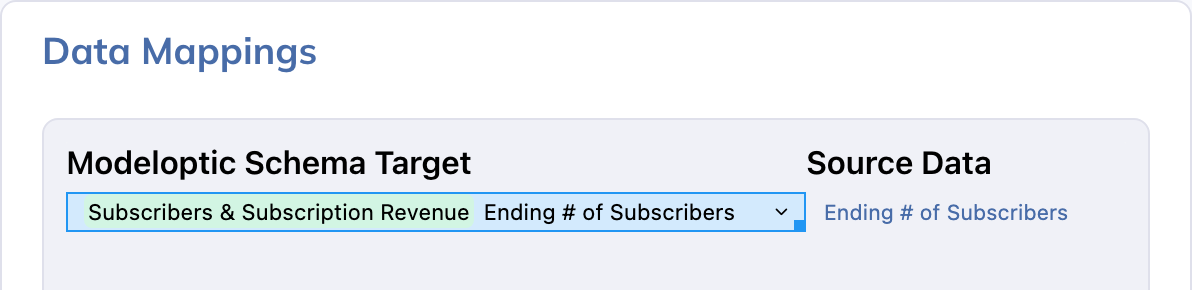
For an additional connection, assign each source line to an eligible target in Data Mappings. A Logic Rows connection maps directly to global Logic Rows; a Collection Table connection maps to rows in its Target Global Table. The target row’s Historical Option must be External Data. See Connection Targets for setup.
Validation Checks
When you save a mapping, upload a file, or refresh a connection, Modeloptic checks that your historical financials tie. Three checks run on every save:
- Net Income tie: the net income line on the income statement matches the net income line on the statement of cash flows.
- Balance Sheet balance: assets equal liabilities plus equity in every historical period.
- Cash Flow tie: the net change in cash on the statement of cash flows equals the period-over-period change in cash on the balance sheet.
If every check passes, you'll see a confirmation. If any check fails for any period, a validation modal lists which check failed and where. The most common cause is an unmapped or incorrectly mapped account - fix the mapping and save again to re-run the checks.
If you have unmapped accounts when you save, you'll also see an alert listing them:
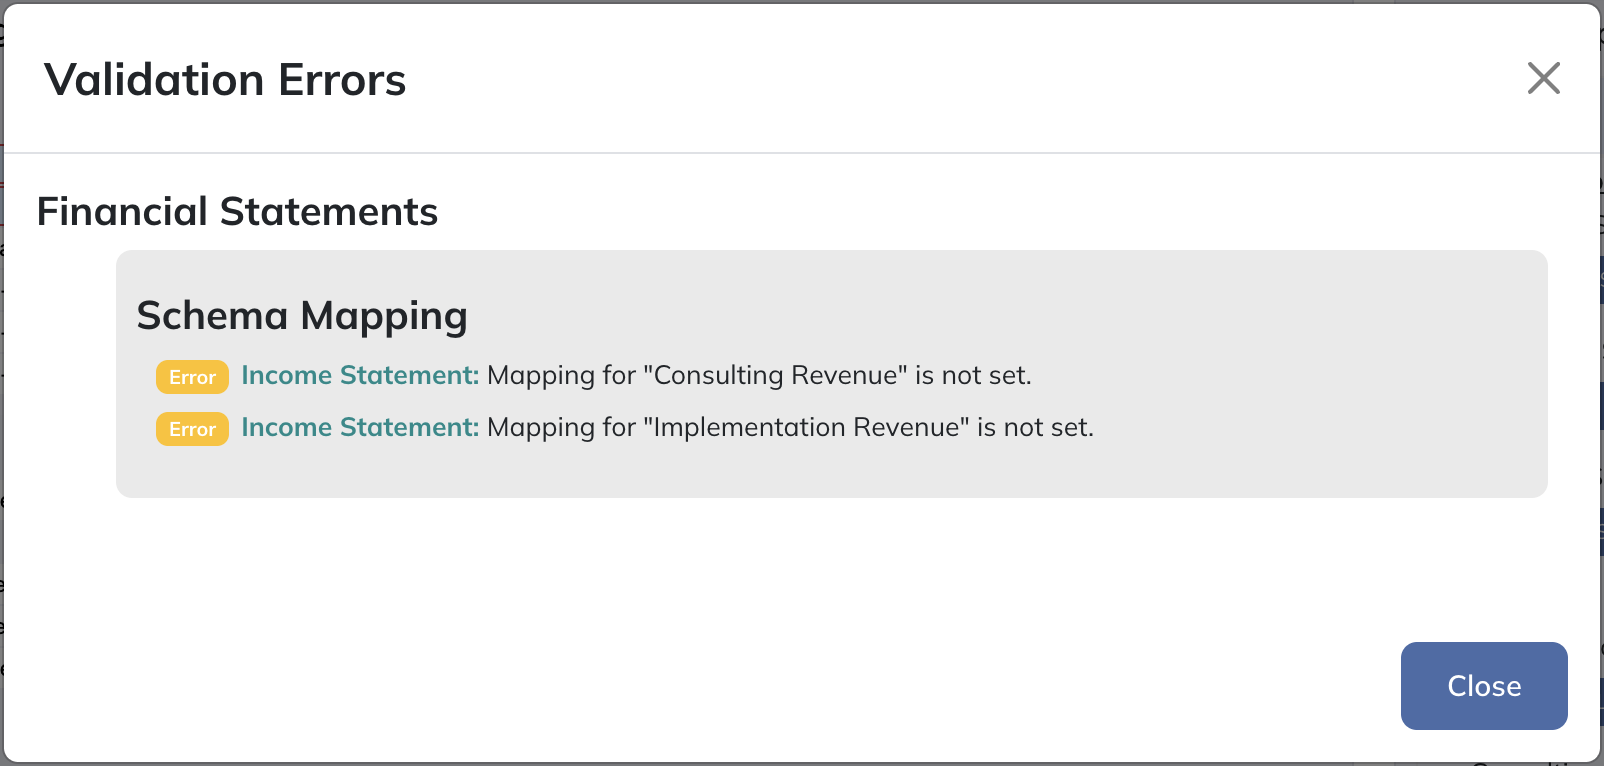
Mapping the remaining accounts and saving again will clear the alert.
History & Rollback
Select the financials connection and click its clock button, Connection History. Apply Rollback & Save restores and saves that connection's settings, mappings, and available source-data snapshot immediately. Eligible historical values are regenerated using current model definitions, and model recalculation follows. Wait for recalculation and review any validation errors. See Restoring a Saved Version for the illustrated workflow.
Source data is not duplicated on every save. Rollback uses the selected entry's source snapshot, or the most recent available snapshot at or before it. If neither exists, current source values are retained. A rollback therefore does not guarantee that every displayed value returns to its value on that date.
Rollback preserves live connection credentials and does not re-fetch an external accounting system or source file. A later refresh or upload replaces the restored inputs through the normal workflow. Unsaved edits to other connections remain pending.