
Advanced Forecasting
Writing Formulas
Write a formula once for a line and it applies across the relevant periods. Modeloptic uses named references and period offsets instead of Excel cell addresses. Select Formula for the row or table-level option, then click the formula field to open Edit Formula.
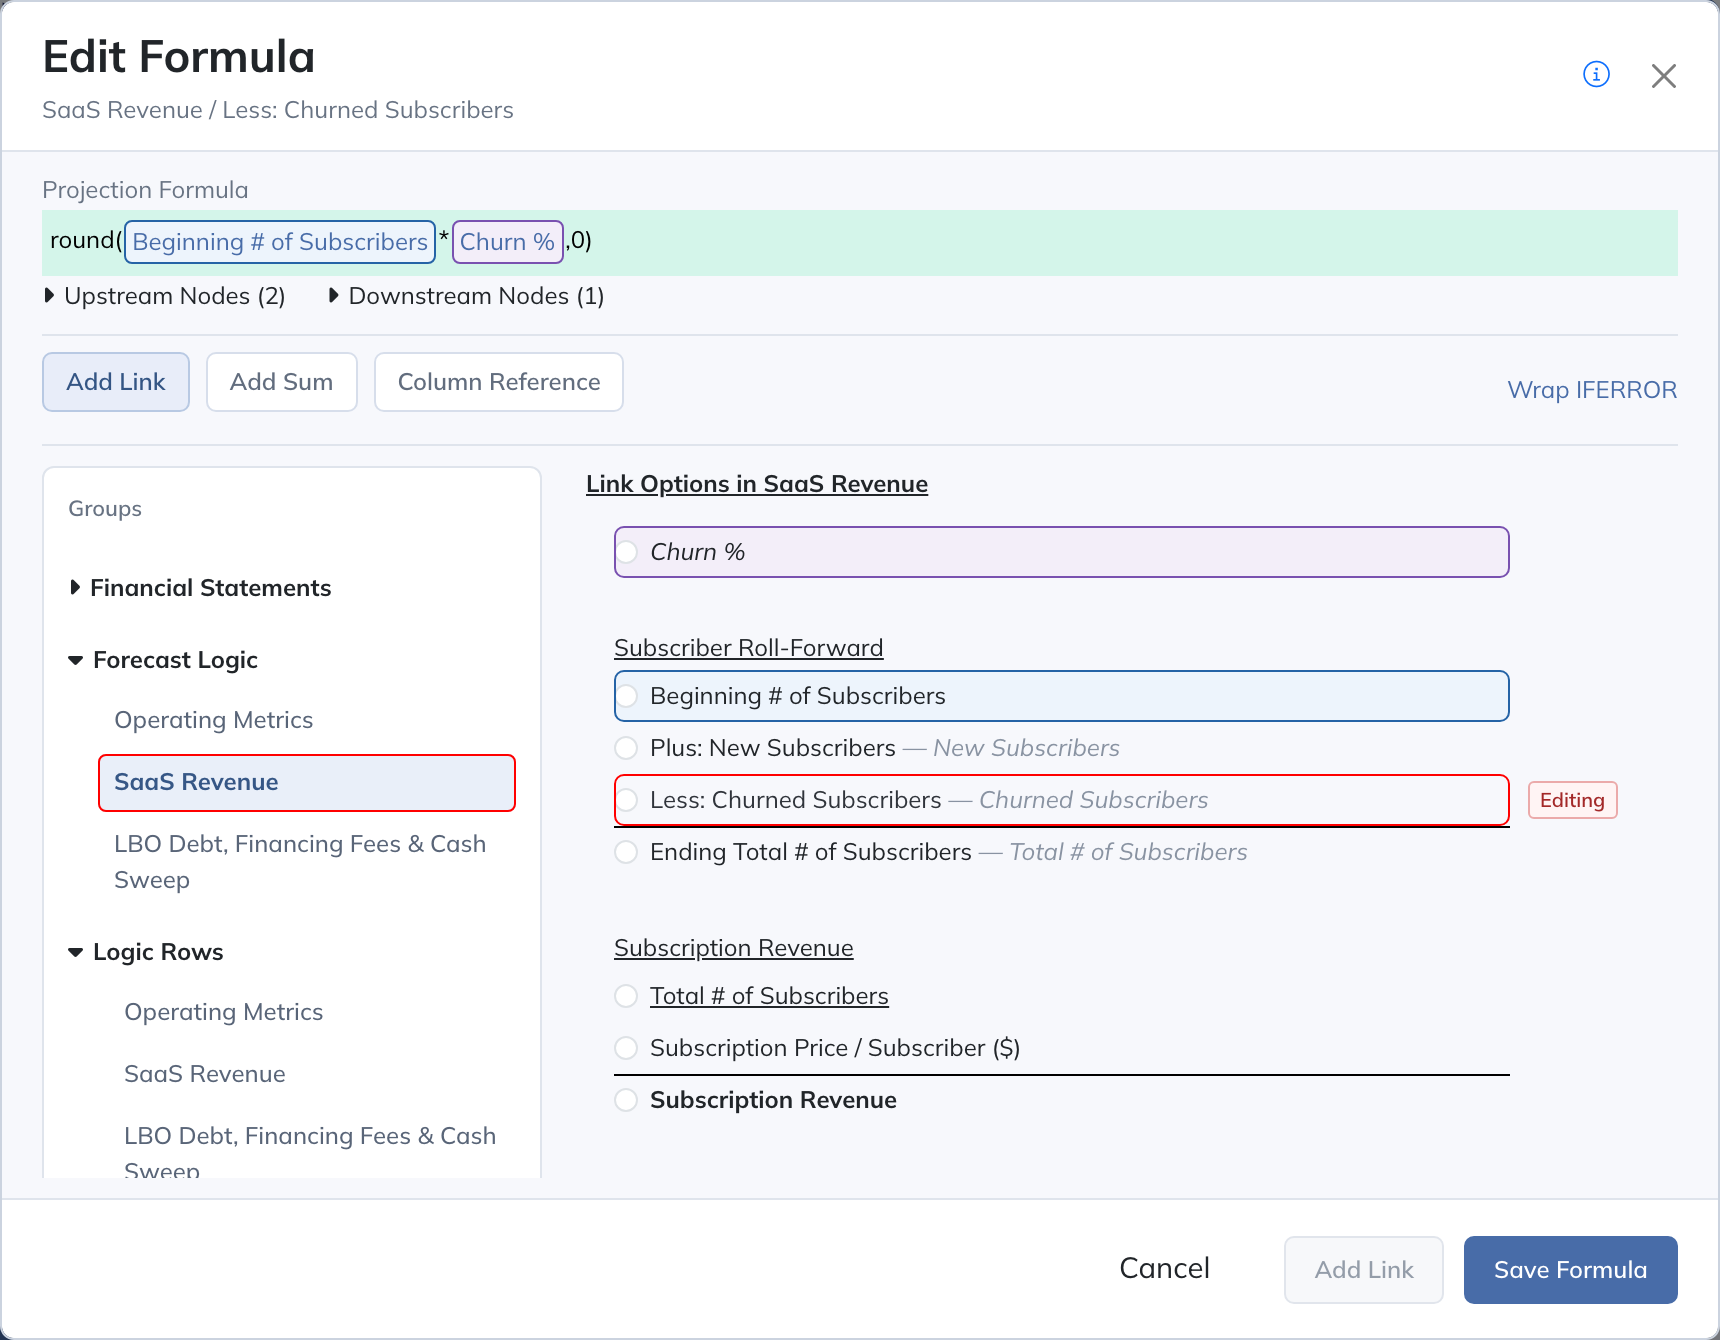
- Choose the source in the reference picker: a View or Logic Row, a Collection Table, or System Defined Values. The choices depend on the field you are editing and your access.
- Select the source row, aggregation, or column. When period or offset controls are offered, choose the intended period. Offset 0 means the current formula period; a negative offset looks backward and a positive offset looks forward, in periods of the company’s Period Resolution.
- Click Add Link to insert the reference at the cursor. Type operators and functions around the reference chips, then add any other inputs.
- Review the source labels and scope. Click Save Formula to apply it to the model, then click Save Projections to persist your edits. Cancel discards the current formula edit.
Example: Units × Price
Place Units, Price per Unit, and Revenue in one View. Set Revenue to Formula, insert the Units reference, type *, and insert Price per Unit. Use current-period references for both inputs. Reusing either input in another View preserves the same calculation.
Reference colors identify source objects. Nearby references or repeated placements can have different outline styles to show context. These reference colors are separate from the model grid’s blue-hardcode convention. Hover a reference to reveal its navigation control; follow it to inspect the source.
Reference tools
- Add Link selects one row or value. Add Sum lets you select several eligible rows and inserts their sum.
- Column Reference returns a user-defined column value. Column Lookup uses a List or True/False relationship to find a column value. Row Lookup follows that relationship to a time series row. The picker offers only the operations valid for the current source.
- System Defined Values provide period indexes and flags such as whether the current period is projected or the first projected period. Labels and options follow the company’s Period Resolution.
- Use Dynamic Offset uses a configured timing assumption for a formula reference. See Row-Level Dynamic Offsets for Logic Rows, or Collection Table Dynamic Offsets for Collection Tables.
- Wrap IFERROR handles an expected error, such as division by zero. Review the fallback value; do not use it to hide a broken reference.
Supported functions include SUM, IF, AND, OR, NOT, MIN, MAX, ROUND, ROUNDUP, ROUNDDOWN, AVERAGE, IFERROR, MOD, and QUOTIENT, plus +, -, *, /, and ^. Formulas can be copied between formula fields; check the references after pasting.
Use Where Is This Row Used? to trace inputs, dependents, and View placements. Transaction and DCF editors offer their own local sections alongside model sources; reporting pickers choose display sources rather than editing the underlying model calculation.
Row-Level Dynamic Offsets
A formula reference can be shifted by a fixed Offset, such as -1 for the prior period; see Writing Formulas. A Dynamic Offset turns that lag into an input instead. You store the lag once on the Logic Row, and every reference that uses it shifts together, so changing the lag means changing one number rather than editing each reference.
It takes two settings: Enable Dynamic Offset on the row holds the number, and Use Dynamic Offset on each reference applies it. Negative offsets look back, so a two-month lag is -2.
Example: customers pay two months after the sale. Give the Cash Collections row a Dynamic Offset Input of -2 and set its Projection Formula to Revenue with Use Dynamic Offset checked. June collections then equal April revenue. To model faster collection, change the input to -1.
Setting Up the Offset
- Open the Logic Row from any View or from its Logic Row Group, and set Projection Option to Formula.
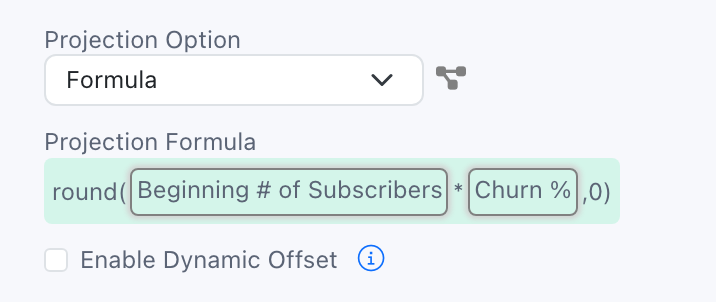
- Under Projection Formula, check Enable Dynamic Offset and enter a whole number in Dynamic Offset Input. Offsets are measured in periods of the company’s Period Resolution: months, quarters, or years. A negative value looks back, a positive value looks forward, and 0 is the current period.
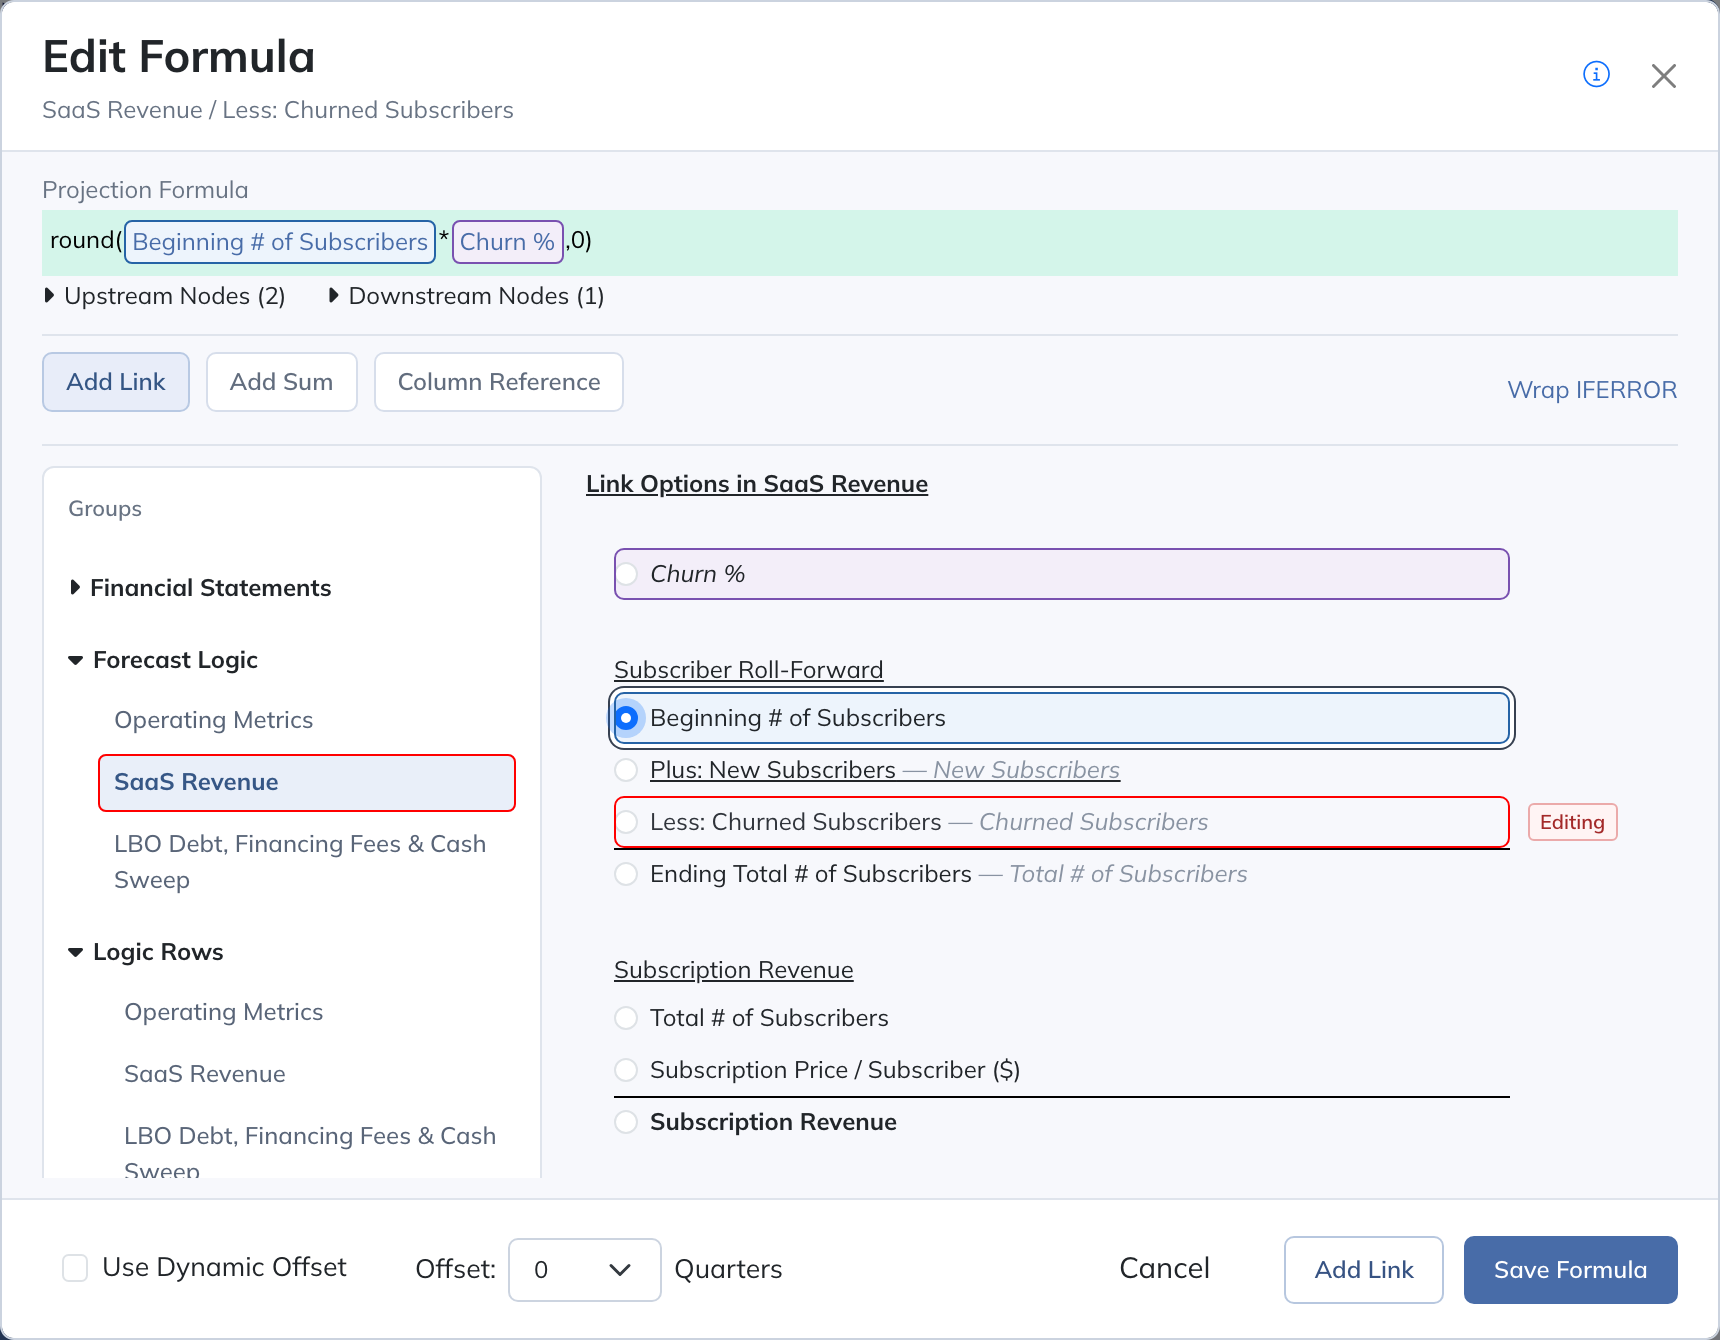
- Open the Projection Formula, select the reference to shift, and check Use Dynamic Offset in the footer. Click Save Formula, then Save Projections.
How It Behaves
- The offset is one number for the row. It does not vary by period.
- Every reference marked Use Dynamic Offset in the formula uses the offset of the row that contains the formula, not the row being referenced.
- Only a Logic Row’s Projection Formula supports it. Historical and aggregation formulas do not.
- Turning off Enable Dynamic Offset removes Use Dynamic Offset from every reference in the formula.
Rules for Every Dynamic Offset
These rules apply to Logic Rows and to Collection Table Dynamic Offsets:
- A reference uses either a fixed Offset or the Dynamic Offset, not both.
- Only references added with Add Link can be shifted. Column References and lookups can’t.
- A shifted reference that lands in a historical period reads the referenced row’s historical values. It returns 0 before the model’s first historical year, or where the row has no historical value, such as a row whose Historical Option is Blank.
- Dynamic Offsets carry through to Excel exports as cells: in column A of a Logic Row, or in a Collection Table column named with its Dynamic Offset Label. Shifted references read that cell through OFFSET formulas, so changing it in the workbook changes the lag.
Logic Rows and Collection Tables Compared
| Logic Row | Collection Table | |
|---|---|---|
| Where the lag is stored | One number on the row | One per item, or one for the whole table |
| How it is set | A whole number in Dynamic Offset Input | A hardcode or a formula, rounded to a whole number |
| Formulas that can use it | Projection Formula only | Historical and projection formulas |
Use a Collection Table Dynamic Offset when the lag differs by item, such as each customer’s payment terms.
Split by Period
This forecast option is useful if you'd like to break the forecast period into sub-periods and forecast each of them using a different methodology. For example, maybe you'd like to forecast the remainder of the current year using hardcodes, and then want to use a period-over-period growth rate thereafter:
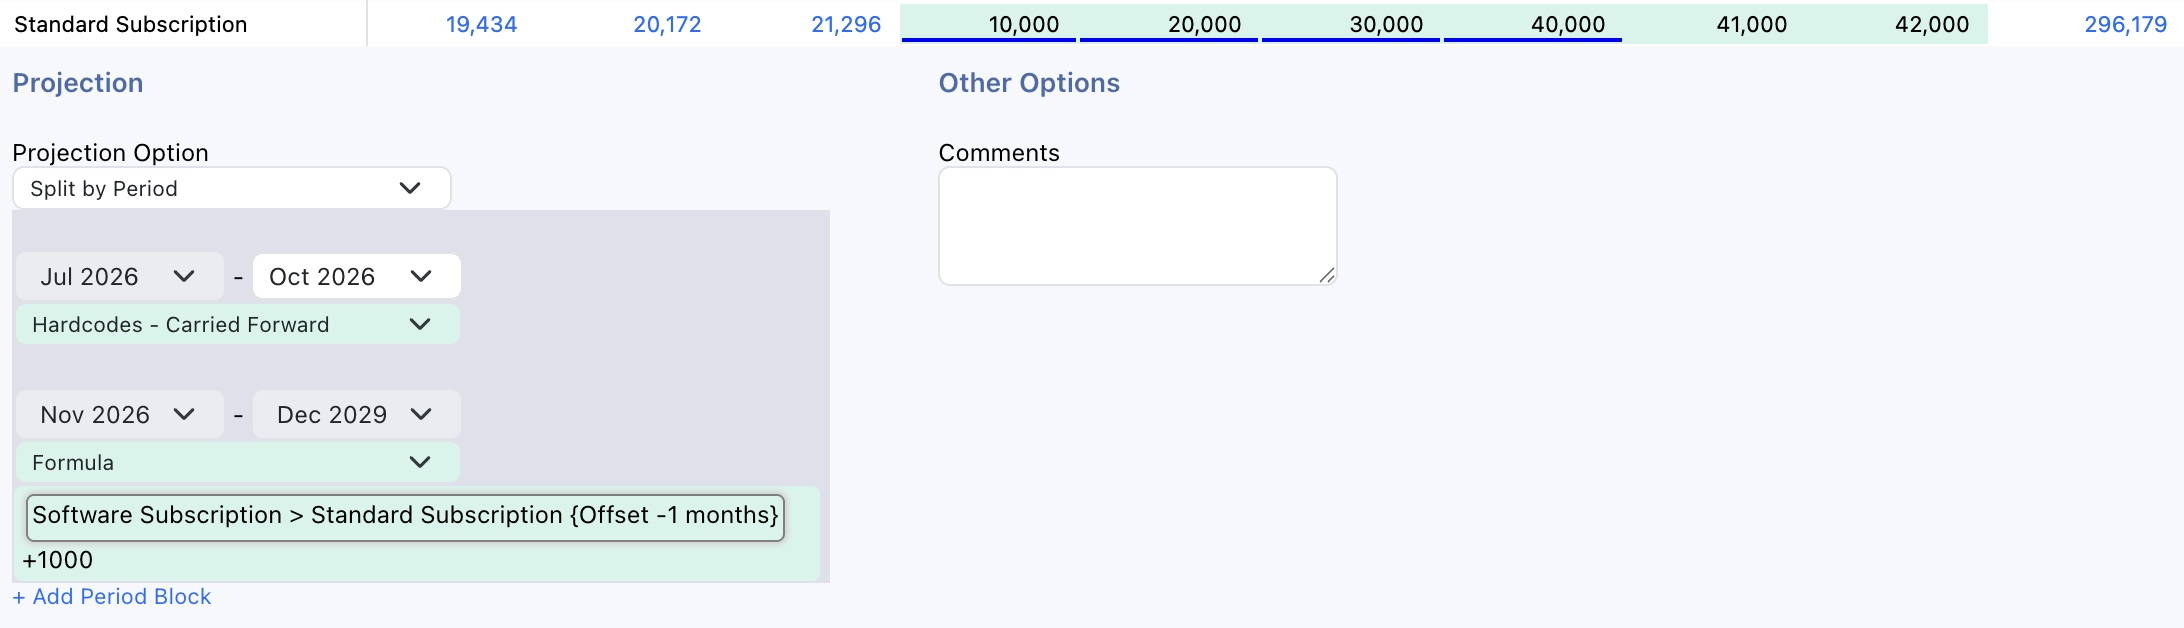
You can include as many sub-periods as you'd like, and can add a new one using the "+ Add Period Block" button.
You can select a forecast option for each period block using the orange drop-down menus. The same options are available here as are available for a standard line item:
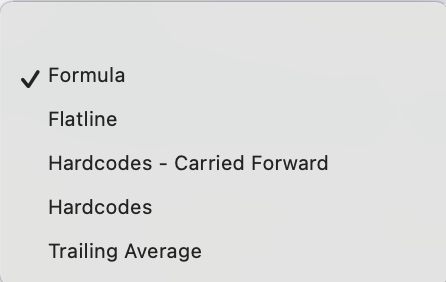
Note that you must be in Basic Mode (not Advanced Mode) to edit these options.
Peelback Mode
Modeloptic defaults to "back-filling" your Projection Sets with the latest historicals when they become available. That means that when January ends, for example, your initial full year budget will now have one month "covered up" with historicals.
Sometimes you don't want the historicals back-filled, and what you actually want is to see what you were projecting previously. "Peelback Mode" is what lets you do that.
If you're on the Model tab and have a Projection Set selected that has a start date in the past, you will see an option above the Projection Set selector to enable "Peelback Mode":
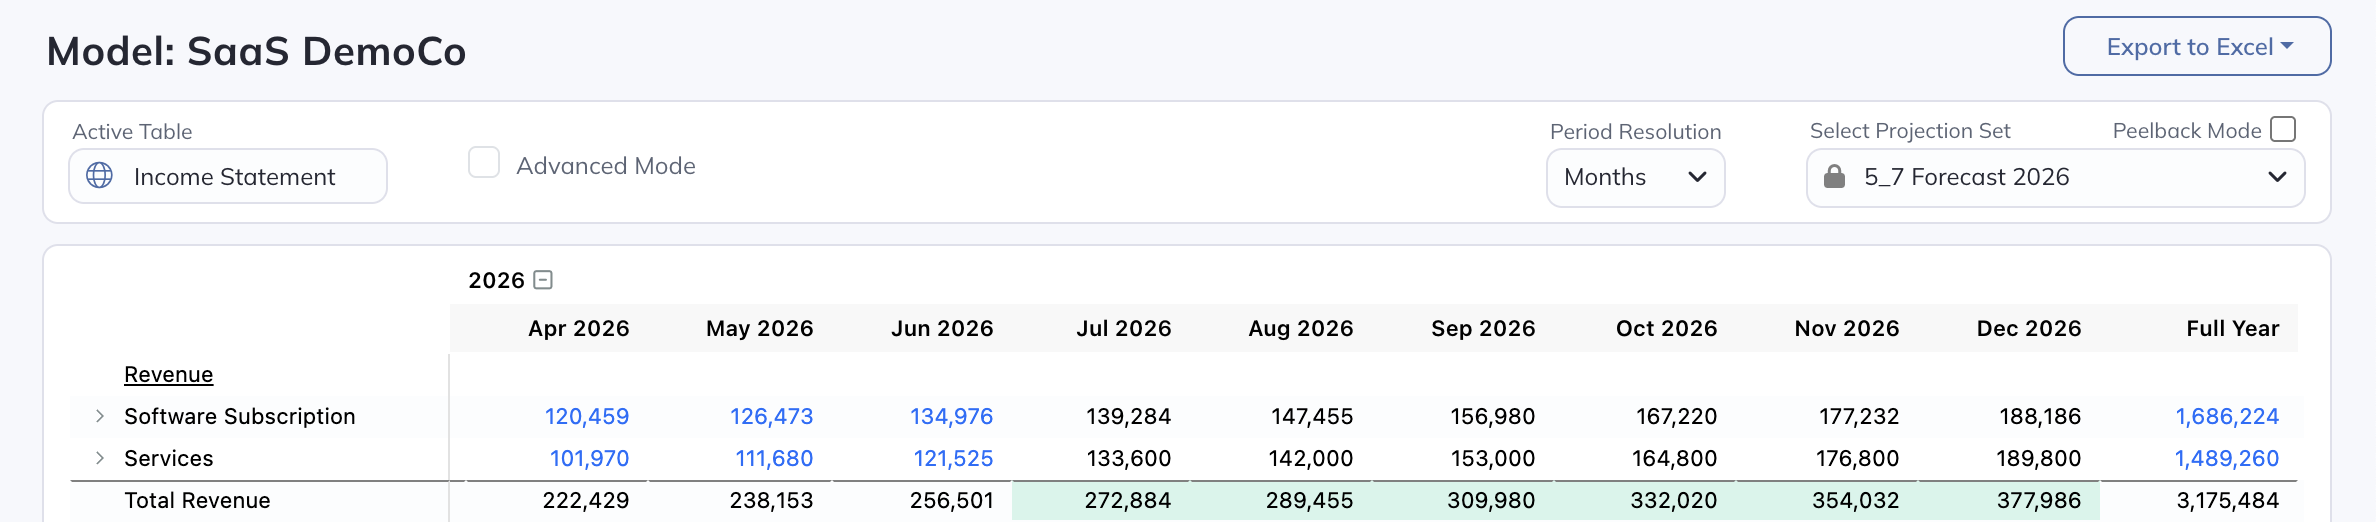
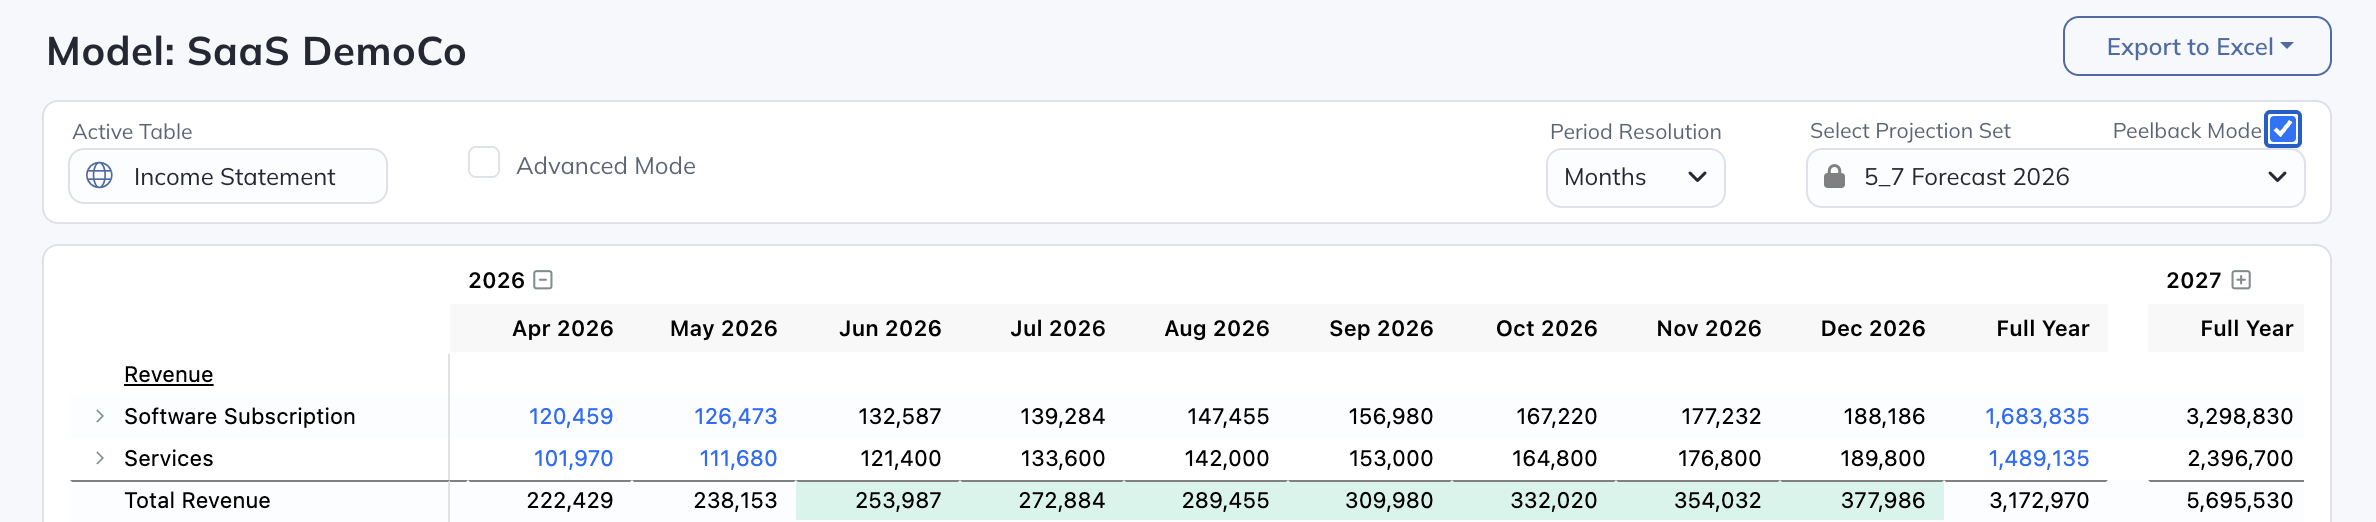
This mode will "peel back" the historical periods that have been layered in over time, so you can see what you were projecting back when the Projection Set was locked.
You will also be able to export to Excel in Peelback Mode, just like you are normally.