Variance Analysis
Overview
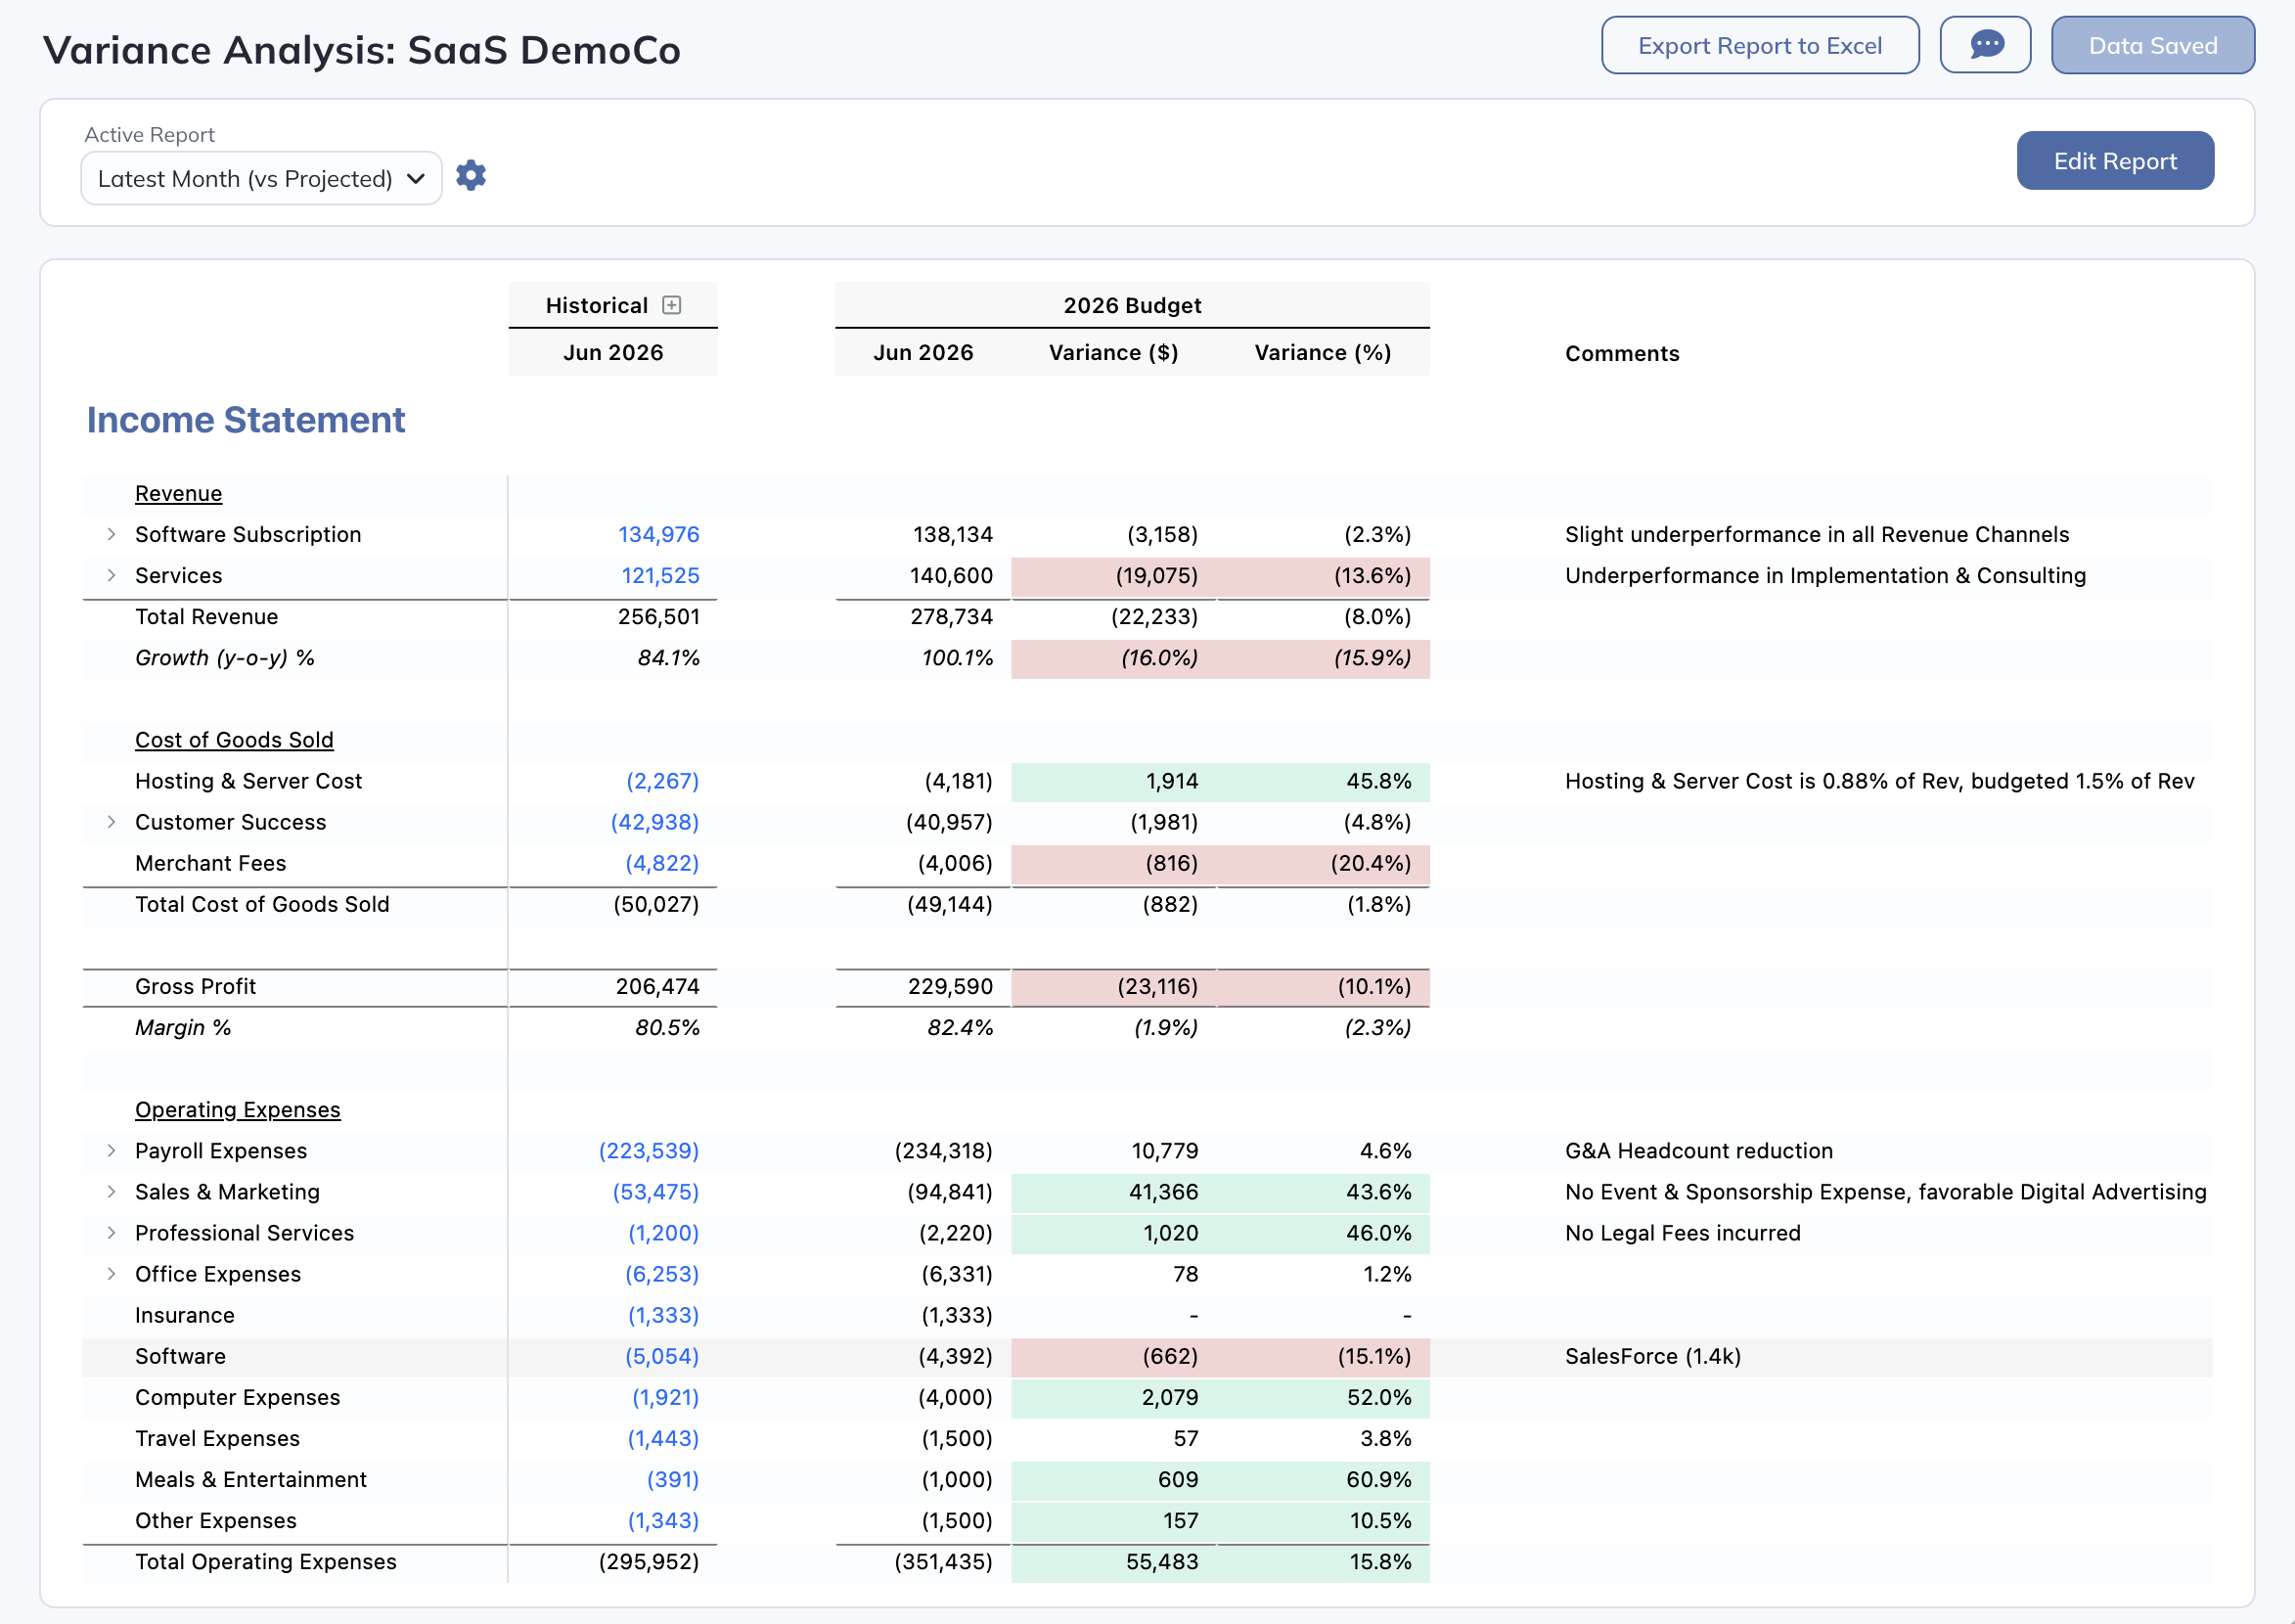
Modeloptic's Variance Analysis tool allows you to measure your company's performance against your prior forecast(s), compare historical periods against other historical periods, compare one set of projections against another, and much more. These calculations are automatically generated, saving you hours of time versus needing to wrangle this data manually in Excel.
Note that subsets of this variance analysis can be included in objects on the Dashboard and Reports pages, which are discussed in more detail in the Dashboard and Reports sections of this guide.
To access the Variance Analysis page, select "Variance Analysis" from the menu. When opened, the Variance Analysis page will look something like this:
Managing Variance Reports
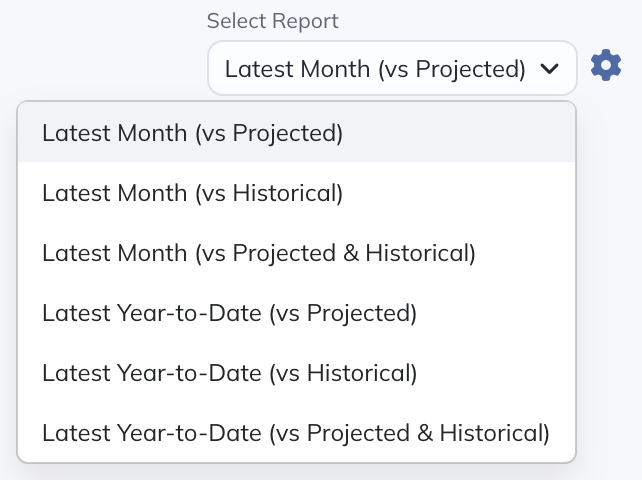
The analyses on this page are organized into Reports, and each Report is readily customizable. Your account will come with several Reports pre-loaded, which you can toggle between using the dropdown near the top right:
Clicking the gear icon will open up the "Manage Reports" screen, which looks as follows:
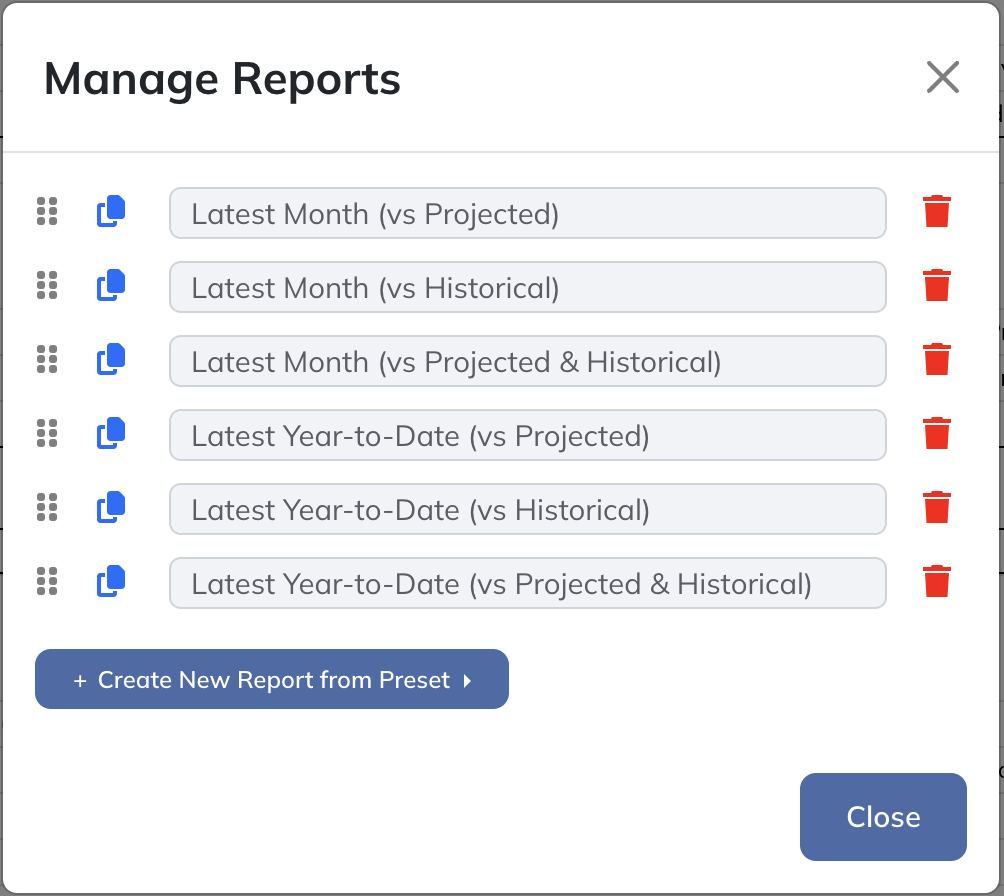
Here you can reorder, rename, clone, delete, and create new reports.
Report Settings
To customize a report, back on the main screen, choose the report in "Select Report", then click "Edit Report". This opens the report settings modal, which will look something like this:
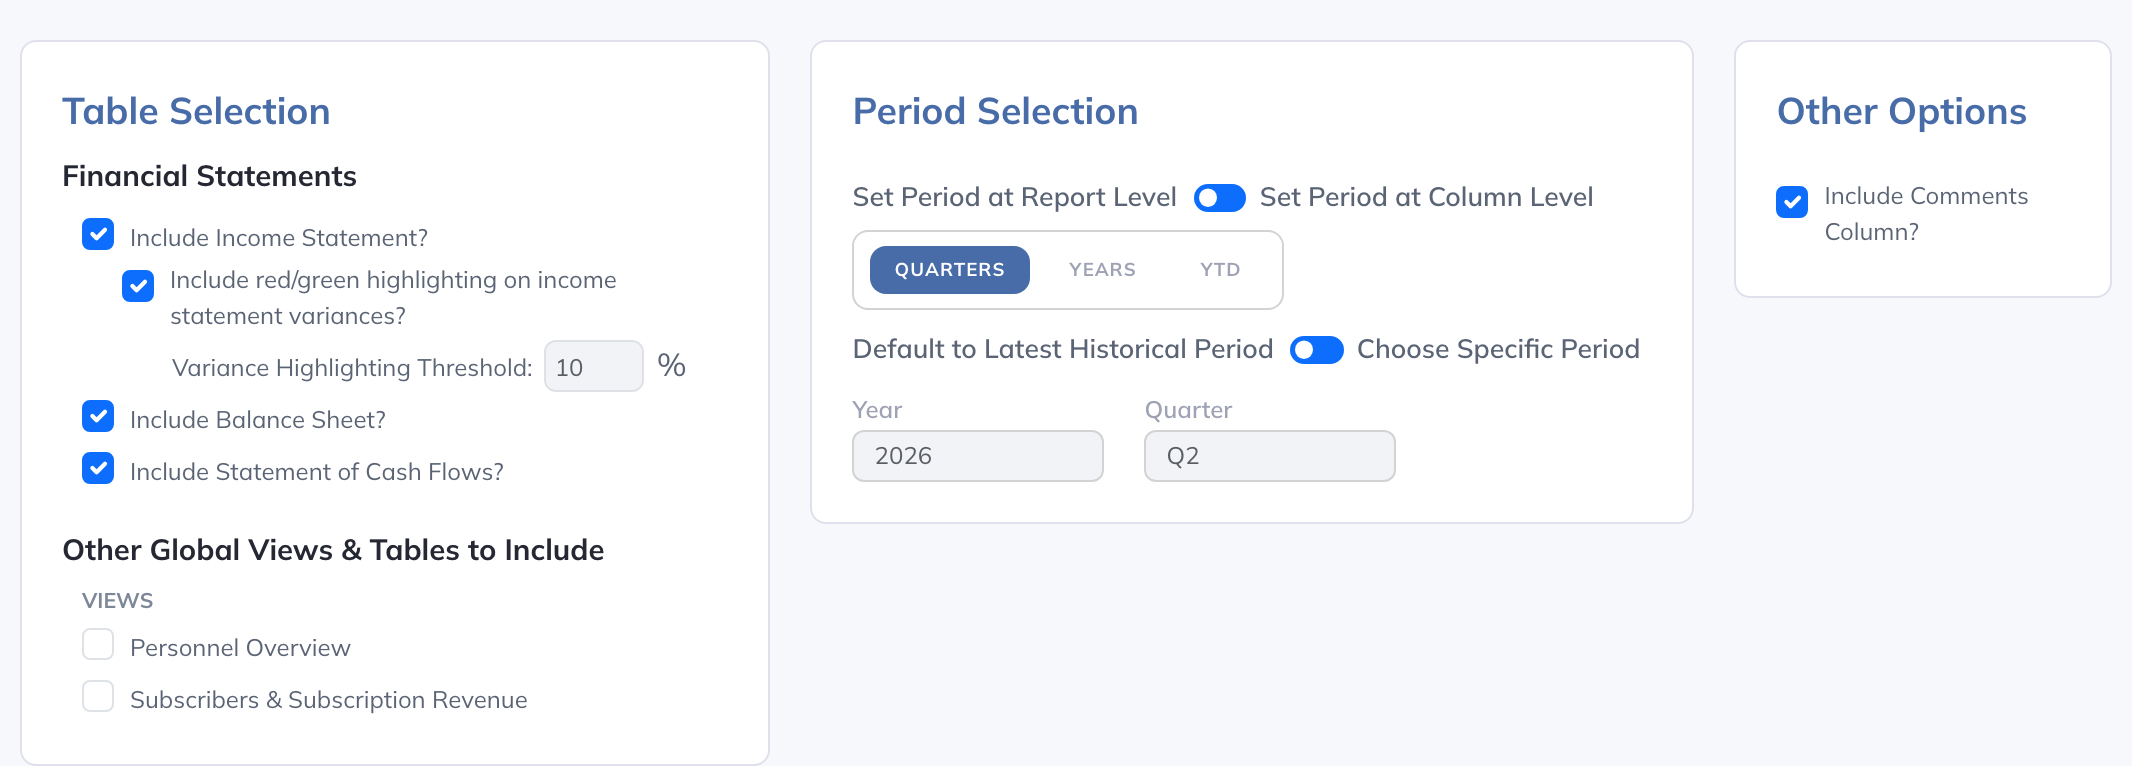
The Table Selection section allows you to choose which financial statements you would like to see on this Report, as well as which eligible global Views and Collection Tables you would like to include:
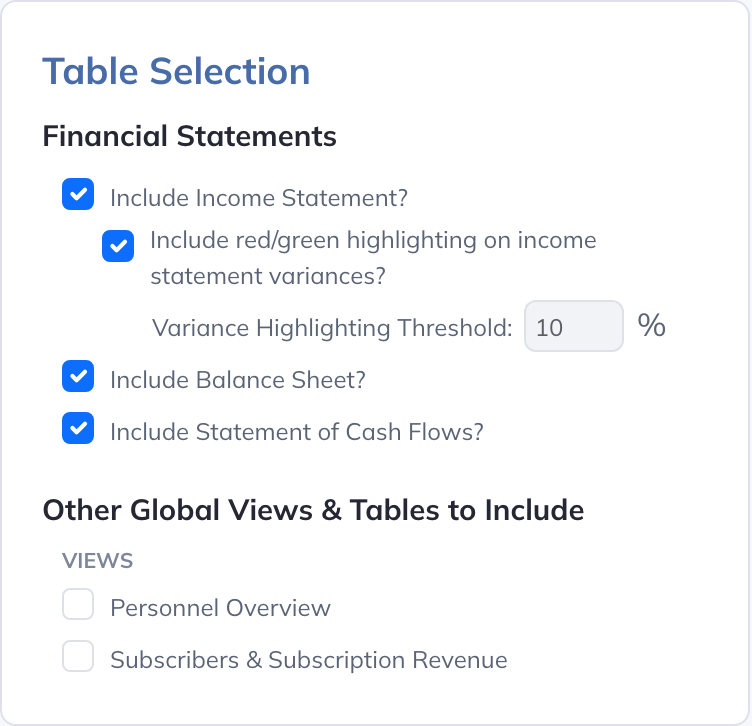
For example, if you would only like to see Income Statement variances in this Report, you could de-select the checkboxes next to "Include Balance Sheet?", "Include Statement of Cash Flow?", and any other global View or Collection Table available. Once saved, the Report would then only include Income Statement items. You can also optionally include red and green highlighting on the "Variance ($)" and "Variance (%)" columns, as well as set the threshold percentage beyond which the highlighting would be applied to a particular account.
The Period Selection section allows you to select which periods to display in the Report:
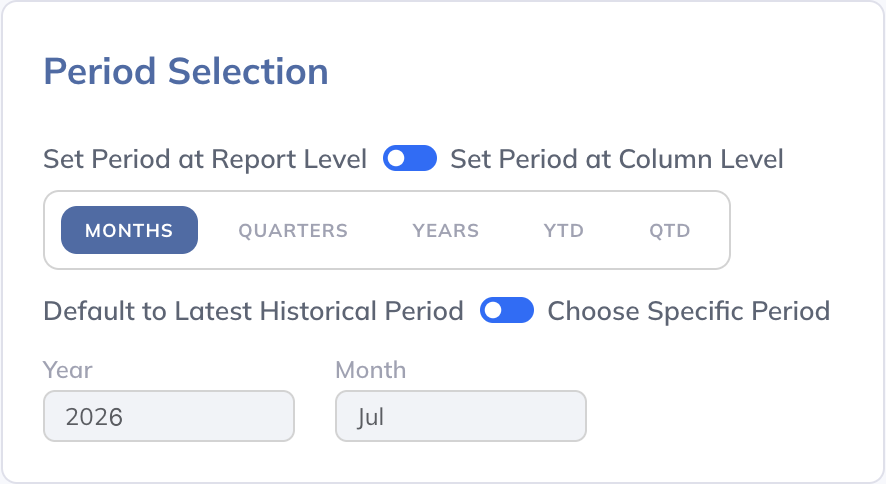
The first setting in this section is the toggle between "Set Period at Report Level" or "Set Period at Column Level". If you'd like all of the columns in your Report to display data from the same period, it's best to use the "Set Period at Report Level" setting, whereas if you'd like to show different periods in different columns, you'll likely want to select the "Set Period at Column Level" (especially if you'd like to show a combination of Months/Quarters/Years/YTD/QTD granularity within a single Report). If you select the "Set Period at Column Level" option, you will then choose which period you'd like to be displayed for each column independently. See below for more detail on how this works.
If you select the "Set Period at Report Level" option, you'll be shown several additional period options to choose from. The first is which period granularity you'd like to use (Months, Quarters, Years, YTD, or QTD). The second is to choose the toggle between "Default to Latest Historical Period" and "Choose Specific Period". If you choose "Default to Latest Historical Period", the latest historical period for the period granularity that you've selected will be automatically chosen for you, and will also automatically update when you change the Latest Historical Period setting within your account on the Historical Data tab. If you select "Choose Specific Period", you can select the specific period of interest, and the period won't automatically update when your Latest Historical Period changes.
The Other Options section presents you with the "Include Comments Column?" setting, which will add a column where comments can be entered alongside each account in your Report (see below for more detail on this).
Column Settings
You can customize which columns appear in your Report in the "Columns" section at the bottom of the "Editing Report" screen:
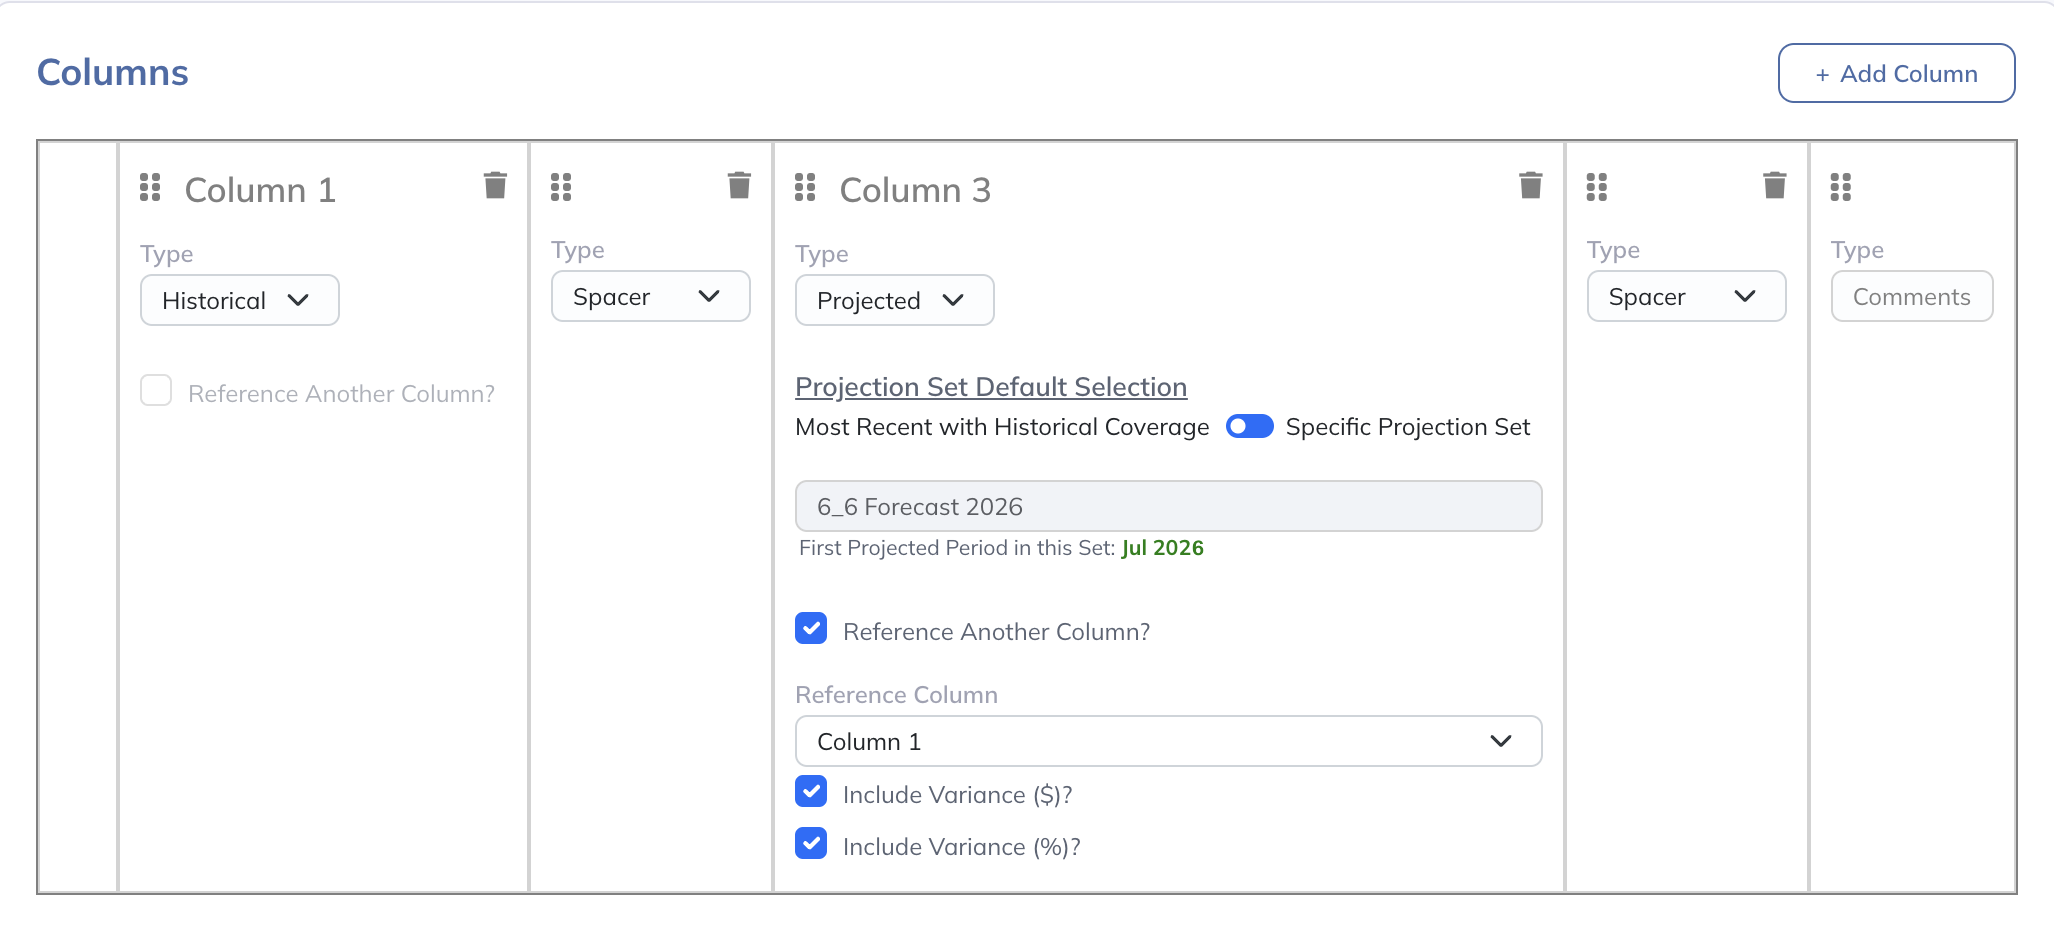
To add a new column, click the "+ Add Column" button on the top right corner of this section. Columns can be reordered using the grip icon in the top left of the column of interest, and can be deleted using the trash icon in the top right of the column of interest.
Each column needs to have a "Type" set. "Historical" and "Projected" columns will contain numerical values, and "Spacer" columns are blank and can be used for formatting purposes. If you've selected the "Include Comments Column?" option above, you'll also see a column with its type set to "Comments" that can't be edited directly. If you'd like to add or remove this column, simply toggle the "Include Comments Column?" option in the "Other Options" section.
Columns can optionally be toggled to reference another column using the "Reference Another Column?" checkbox:
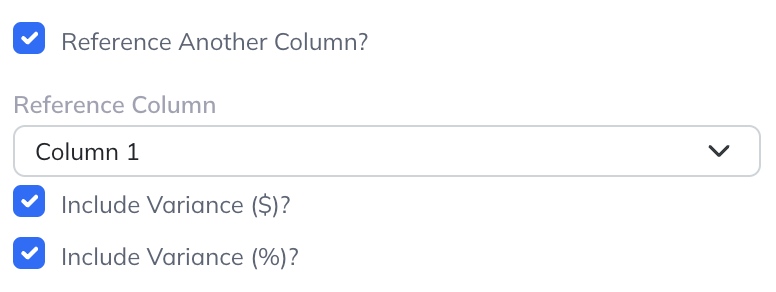
Referencing another column can be done either to compute a variance against that column, or to use the period settings of the referenced column.
Upon selecting this option, you'll then be prompted to select the reference column of interest. You'll also see options for "Include Variance ($)?" and "Include Variance (%)?", which will compute the difference between the referenced column and the current column for each account.
As discussed above, in the "Period Selection" section of the Report settings, you'll select the option to either "Set Period at Report Level" or "Set Period at Column Level". If you select the "Set Period at Report Level" option, you won't be prompted to choose a period within any column because you will have set the period for the entire Report above. If you select the "Set Period at Column Level" option, then any column that hasn't been flagged to reference another column will prompt you to set the period options for that column, which works the same as setting the period at the Report level as described above.
Columns that have their type set to "Historical" can optionally reference other historical columns. When this is done, you will be prompted to select a "Historical Reference Option":
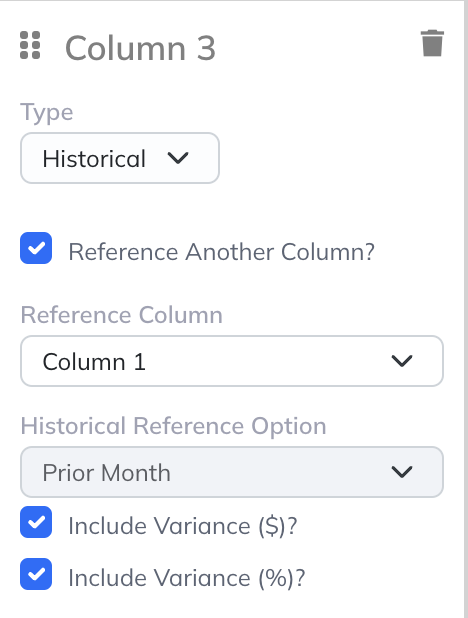
The two options available are "Prior Period" and "Same Period of Prior Year". These settings are useful for creating a very common variance Report comparing the latest month's performance versus the prior month's and versus the same month of the prior year, though they can be used for other purposes as well.
Columns that have their type set to "Projected" will need to have a particular Projection Set selected:
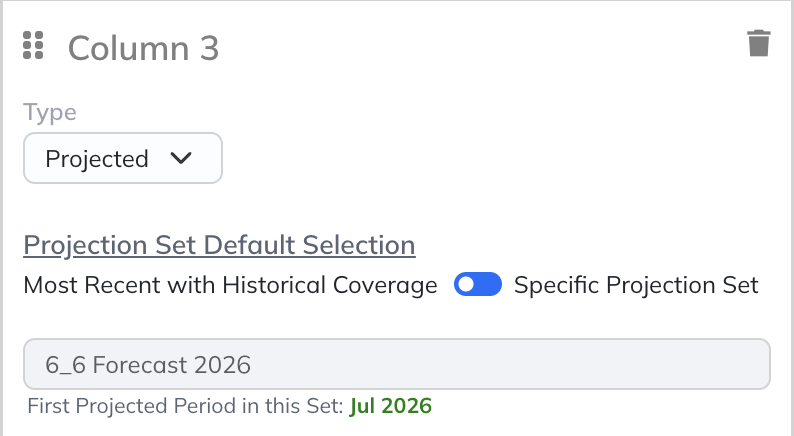
You'll first need to select between the "Most Recent with Historical Coverage" and "Specific Projection Set" options. "Coverage" in this context refers to the periods within a Projection Set that were previously forecast that are now in the past. For example, if you create a Projection Set in January that forecasts Jan-Dec for a particular year, once January ends and becomes a historical period, that Projection Set will then have "coverage" for January of that year.
The "Most Recent with Historical Coverage" option will select the Projection Set highest in the list that has the fewest periods of coverage greater than 0. Like the "Default to Latest Historical Period" period setting option, when this option is selected, the selected Projection Set will potentially change automatically depending on the Latest Historical Period setting on your account and what Projection Sets you've created. The "Specific Projection Set" option will allow you to choose a particular Projection Set of interest. This option is common when running variances against an annual budget, for example.
When the settings are ready, click "Close" to return to the report, then use the page’s save control to persist the changes. Closing the settings modal is not the same as saving the report.
Transaction-Level Detail
If your Modeloptic account is connected to your accounting system, clicking on any of the blue historical numbers on any of the financial statements will open up the transaction-level detail for that account:
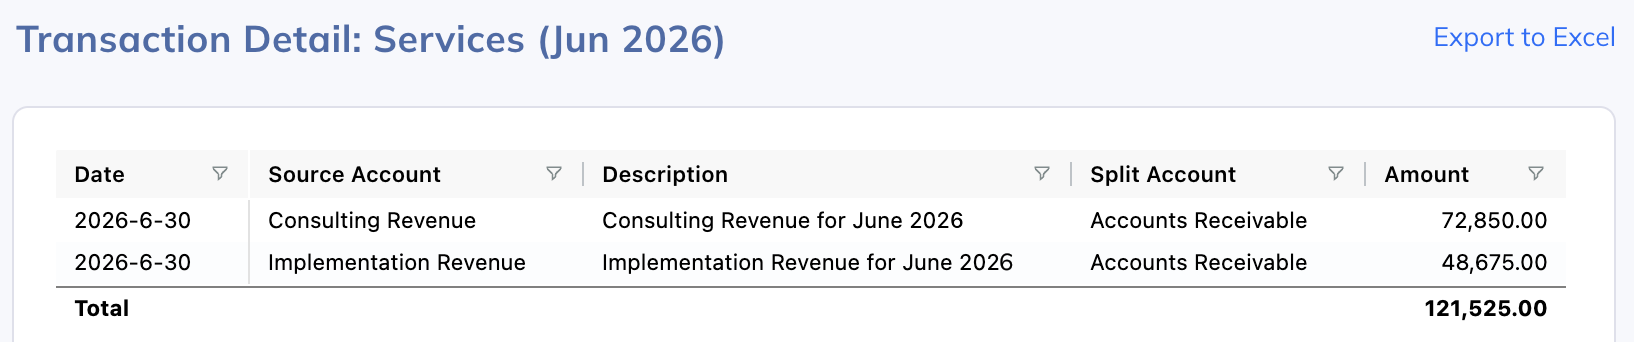
This capability enables you to quickly check what the constituent transactions are for a given account to explore why any variances might exist.
See Additional Historical Periods
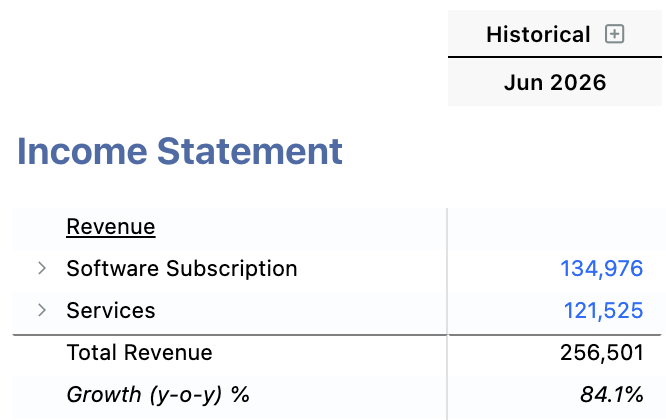
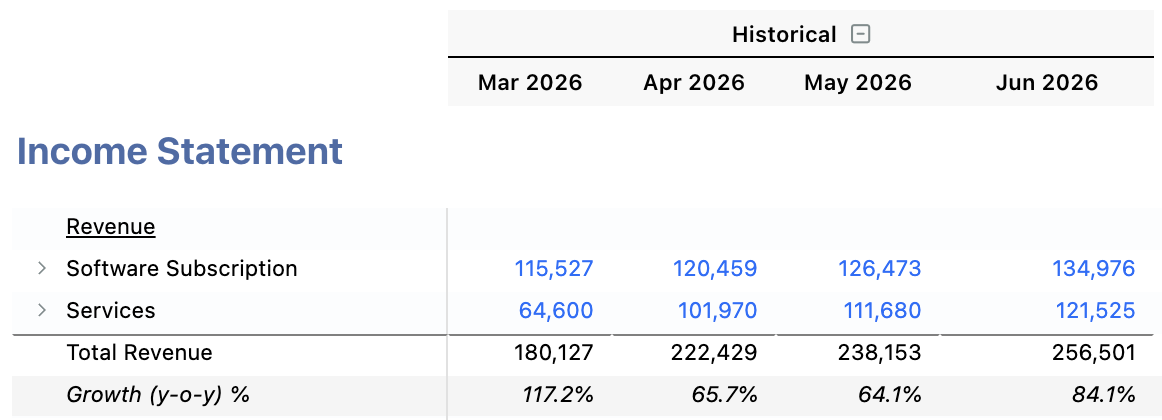
By using the plus icon over certain "Historical" columns, you can optionally show additional recent historical periods for context:
Comments
If you have "Include Comments Column?" selected in the settings for the current Report, Modeloptic allows you to enter in comments for each account:
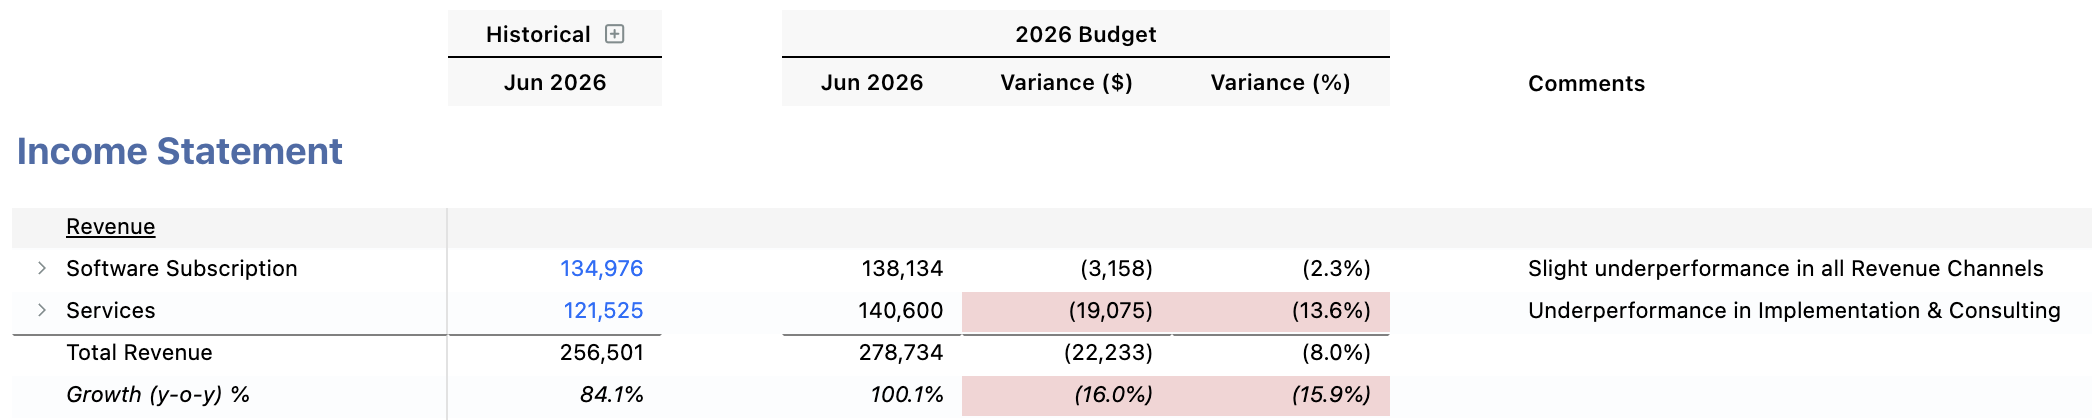
This makes it easy to add additional context when sharing this analysis with other members of the team.
Save comment edits with the page’s save control, the same control used to save report settings.
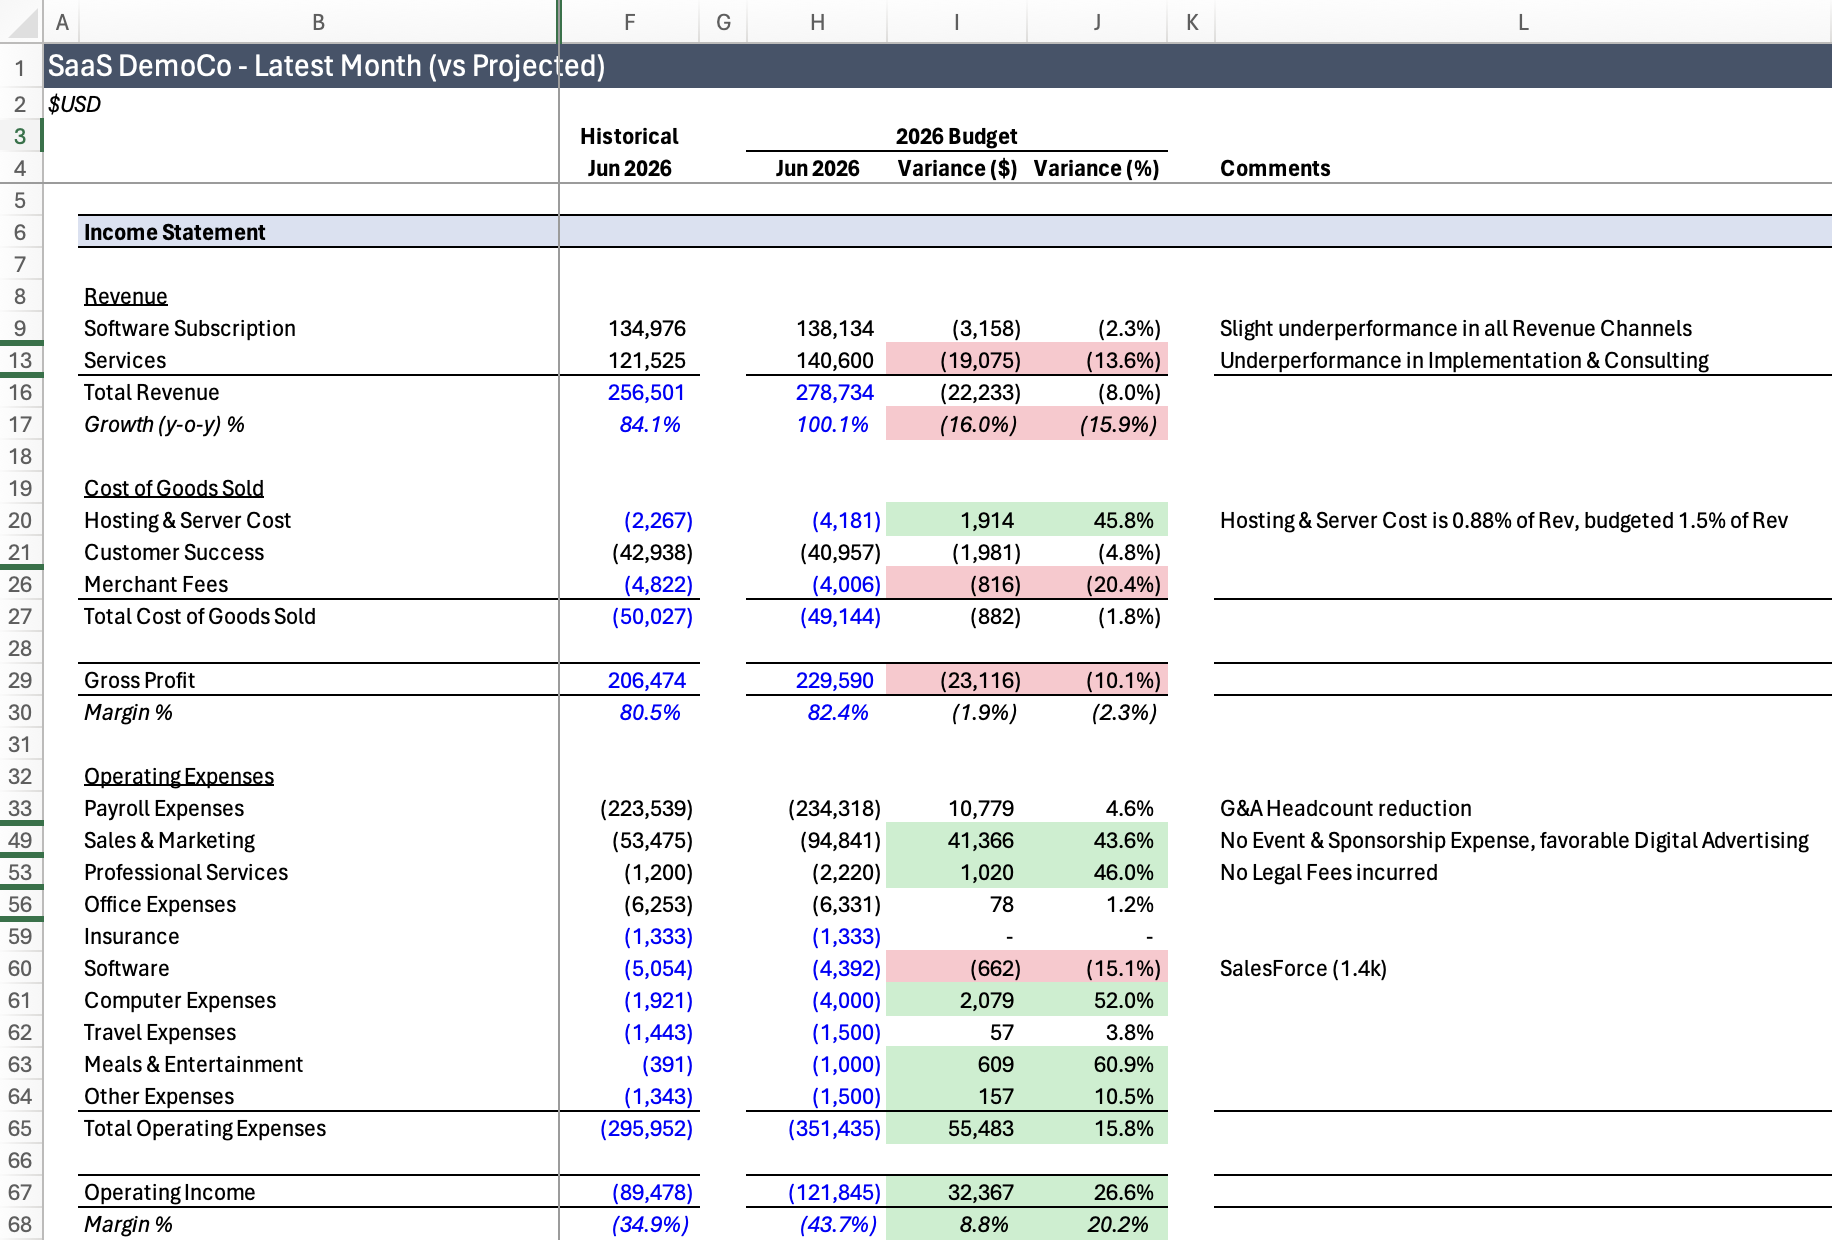
Excel Export
Use Export Report to Excel in the page header. Save any report and comment edits first. The workbook includes the selected report’s values and supported formulas for calculated totals and variances; it does not recreate every displayed source value as a formula.