
Collection Tables
Overview
Use a Collection Table when many items follow the same logic, such as employees, products, customers, or contracts. Use Logic Rows for individual assumptions and calculations; use a Collection Table when the same calculation repeats for every item in a list.
Each row is one item, and each period is a column. User-Defined Columns hold item attributes such as a division or a start date. A table-level formula is written once, as if for a single item, and runs for every item.
Collection Tables work together:
- Standard tables own an item list and forecast one measure for each item by period. With Exclude Timeseries? checked, a Standard table is a plain list, such as a list of divisions.
- One-to-One tables hold further measures for the same items. They share the Standard table’s rows, and a table-level formula that references a related table reads the same item’s row.
- Analysis tables group items by a List or True/False column.
- Multi-Entity Combination tables combine tables from several entities into one, in multi-entity companies.
- A List-Scoped View shows one item’s build at a time.
Example: A Personnel Build
| Collection Table | Type | Role |
|---|---|---|
| Staff List (Total Expense) | Standard | One row per employee, with Division and Is Contractor? columns and start and end dates. Its values are each employee’s total expense, calculated by a table-level formula that adds that employee’s compensation tables. |
| Base Compensation (by Person) | One-to-One, parent Staff List | Each employee’s salary by period. |
| Payroll Tax (by Person) | One-to-One, parent Staff List | A table-level formula that reads the same employee’s Base Compensation. |
| Total Expense by Division | Analysis | One row per division, summing Staff List by its Division column. |
| Individual Person | List-Scoped View | One employee’s build, chosen with Active Item. |
Personnel Presets generate a structure like this one. Staff List is both the employee list and a measure by period, because every Standard table with a time series is both. Add, remove, and rename employees only in Staff List. Every One-to-One table follows it automatically.
Opening Table Settings
To open Edit Table Settings, hover the Collection Table in Model Navigation and click its gear, or choose Table Settings from its gear menu in Edit mode. You can also press s while the Collection Table is open and no text field or modal has focus.
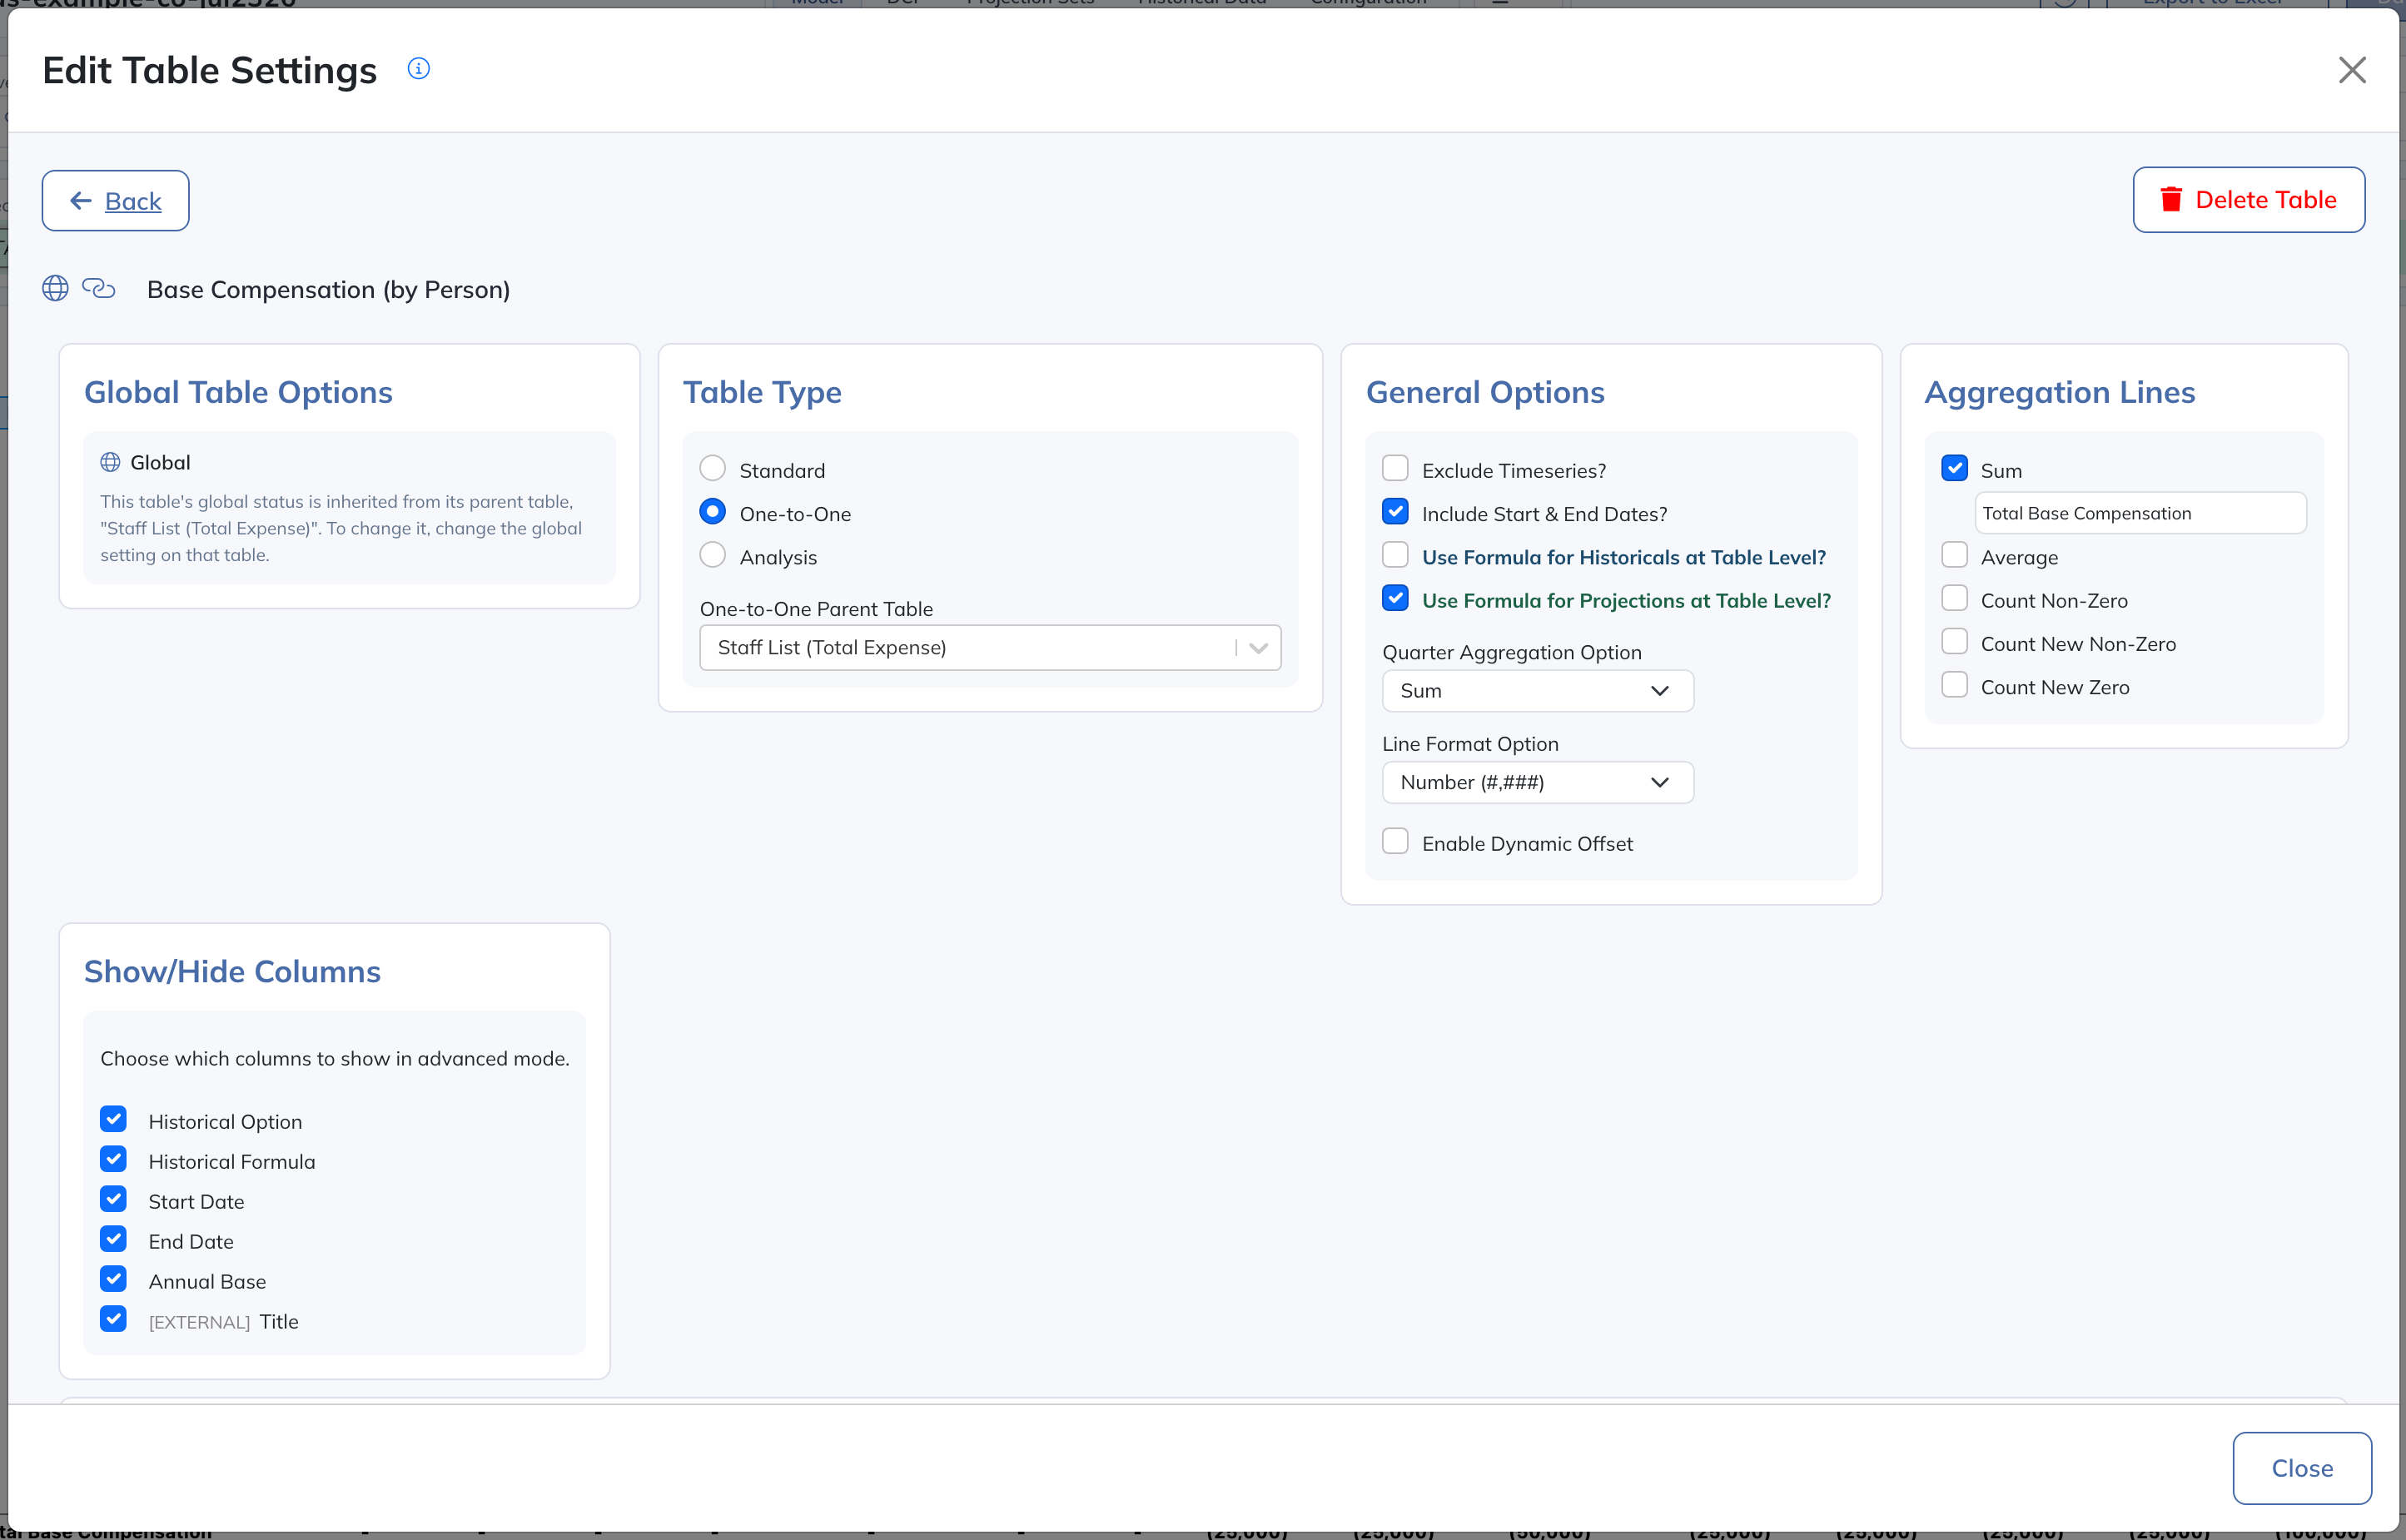
At the top, Back returns to Model Navigation, Delete Table deletes the table, and clicking the name renames it. Delete Table is unavailable while One-to-One tables use the table as their parent. Before deleting a table, repoint or remove the Analysis tables, List columns, and List-Scoped Views that use it; otherwise they show validation errors, and formula references to the table count as zero. The sections below depend on the table type. For a Standard table they are Global Table Options, Table Type, General Options, Aggregation Lines, Show/Hide Columns, and User-Defined Columns, with Excel import at the bottom.
Show/Hide Columns chooses which columns appear in Advanced Mode. For sharing across Projection Sets and access permissions, see Global Tables, Views & Rows.
Table Types
Choose the type under Table Type in Edit Table Settings. Start with a Standard table for the item list, then add related tables for calculations and analysis.
Standard Collection Tables
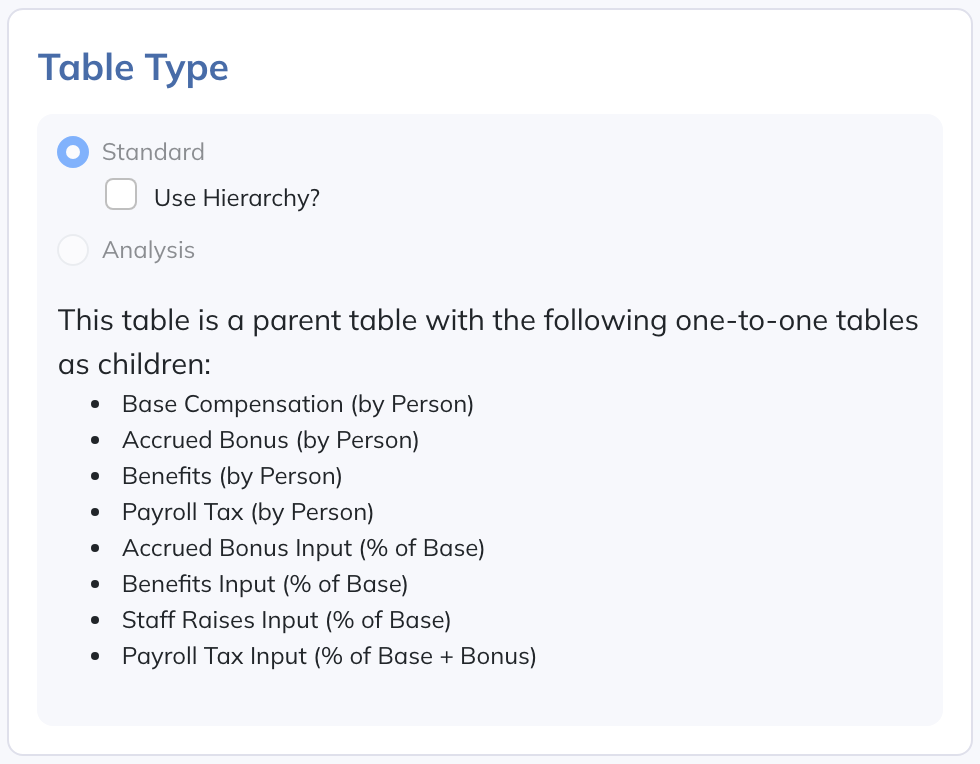
A Standard table owns a list of items, such as employees, customers, or product SKUs, and forecasts a measure for each item by period. Check Use Hierarchy? under Standard to arrange its rows into parents and children; see Hierarchy Tables below.
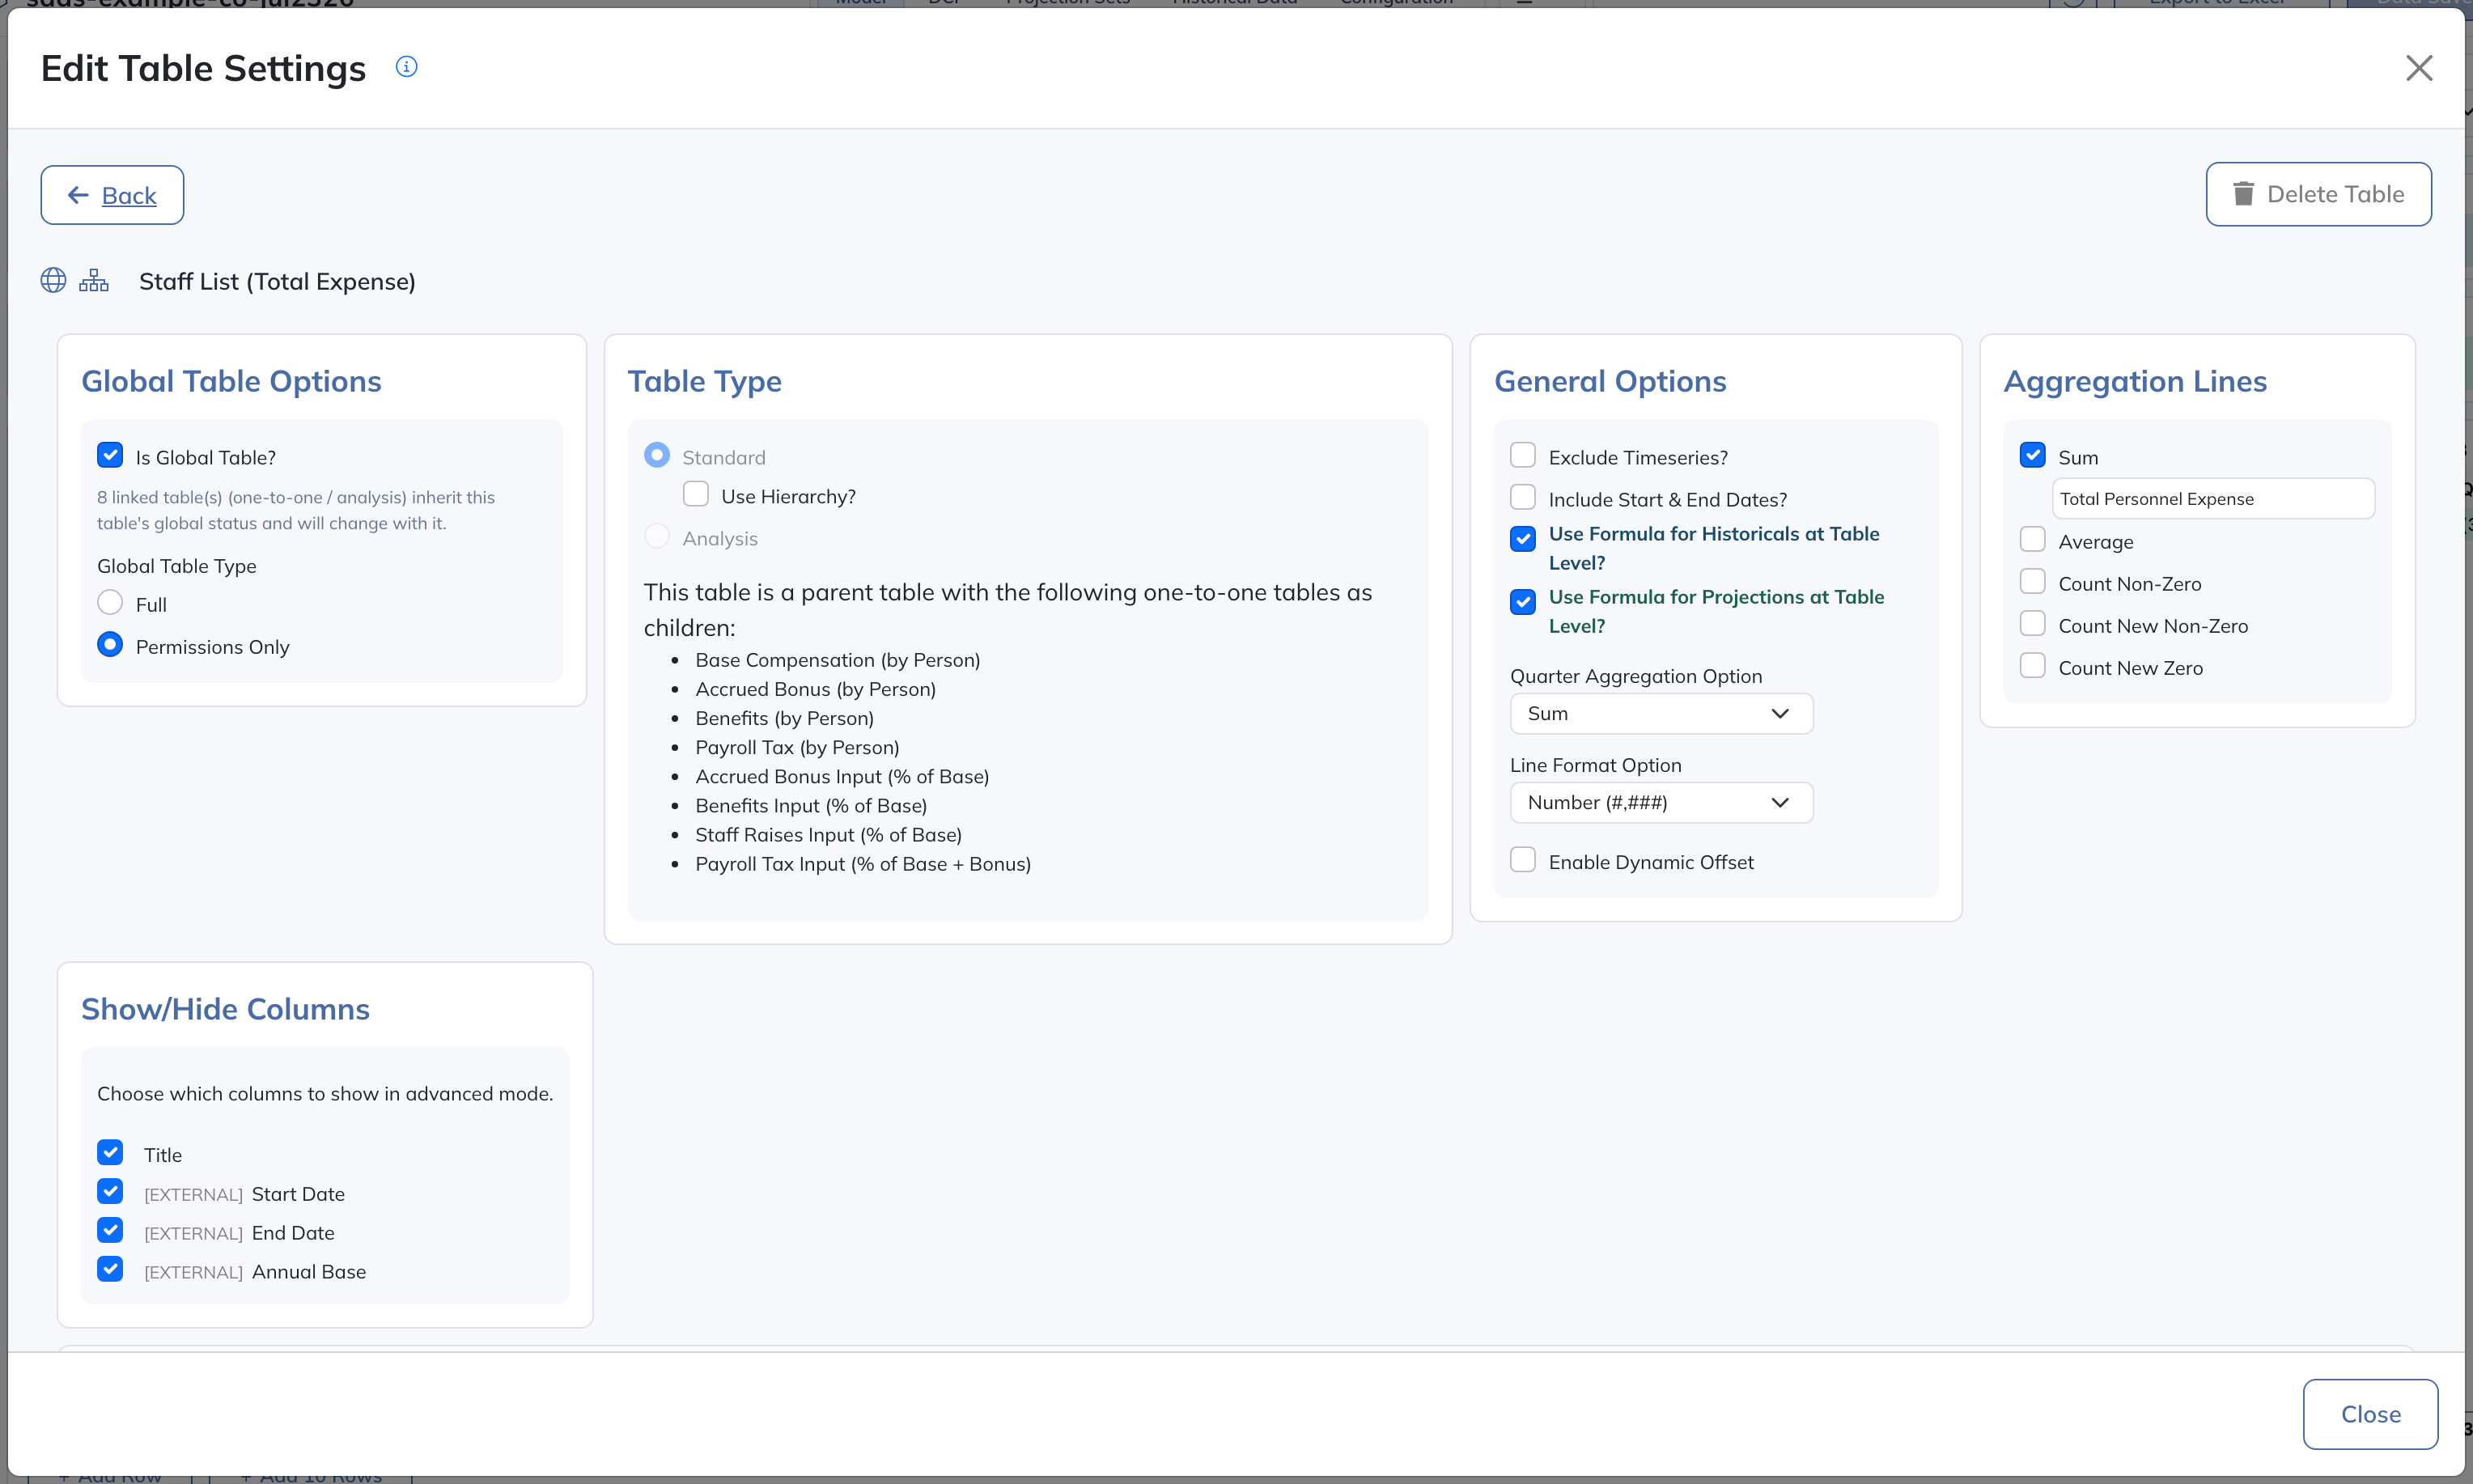
General Options:
- Exclude Timeseries? removes the period columns, turning the table into a plain list, such as a list of departments to use in a List column.
- Include Start & End Dates? adds Start Date (Inclusive) and End Date (Inclusive) to each item. Projected values are zero outside that range, with no proration; historical periods are not affected. An item with a blank Start Date is zero in every projection period. A blank End Date means the item has no end.
- Use Formula for Historicals at Table Level? applies one historical formula to every item instead of setting the Historical Option row by row.
- Use Formula for Projections at Table Level? applies one projection formula to every item instead of setting the Projection Option row by row.
- Month Aggregation Option or Quarter Aggregation Option sets how periods combine into larger displayed periods, as described in Aggregation Options. Choosing Formula adds a table-level aggregation formula above the table.
- Line Format Option sets a common format for every item. Currency formats use the Currency set on the Configuration tab, and the "Show in Thousands" and "Show in Millions" options are only offered when they would scale values relative to your Display Units. See Line Format & Styles for how formats and Display Units affect stored values.
- Enable Dynamic Offset lets formulas shift references by an offset that can differ by item. See Dynamic Offsets.
Aggregation Lines
Aggregation Lines add summary rows below the items. Check a line to add it, and optionally give it a label.
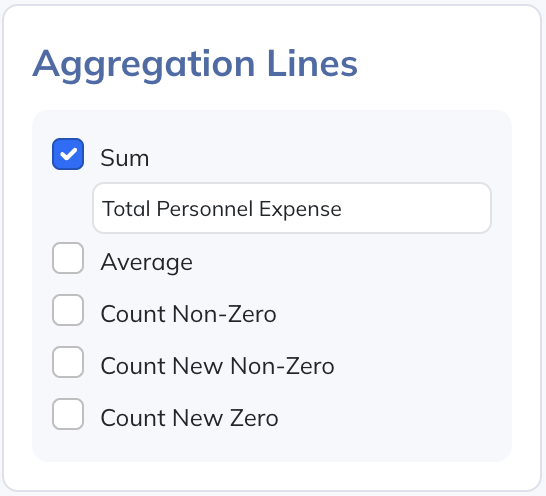
| Line | Calculates | Personnel Example | In Larger Periods |
|---|---|---|---|
| Sum | The total of all items | Total salary | Follows the table’s Aggregation Option |
| Average | The total divided by the number of items, including items at zero | Salary averaged over every row, including people not employed in that period | The last period’s value |
| Count Non-Zero | Items with a non-zero value in the period | Headcount | The last period’s value |
| Count New Non-Zero | Items that were zero in the previous period and are non-zero now | New hires | The sum of its periods |
| Count New Zero | Items that were non-zero in the previous period and are zero now | Departures | The sum of its periods |
A blank value counts as zero. The first projection period is compared with the latest historical period. In a hierarchy table, these lines use top-level rows only.
Formulas can reference each Aggregation Line. To average only items with a value, such as salary per employed person, divide the Sum line by the Count Non-Zero line.
Hierarchy Tables
Check Use Hierarchy? to arrange a Standard table’s rows into parents and children, for example product categories with their products nested beneath them. Click Edit Row Structure below the table, in Basic or Advanced Mode, to open the Edit Row Structure window:
- Drag rows to reorder them and to nest them under a parent.
- Click Add Row to add a row.
- Use a row’s gear for Add New Row Above or Below, Clone Row Above or Below (including its children, when it has any), and Delete Row or Delete Row and All Children.
A parent row always equals the sum of its direct children, in historical and projected periods. Its own formula or option is ignored.
One-to-One Collection Tables
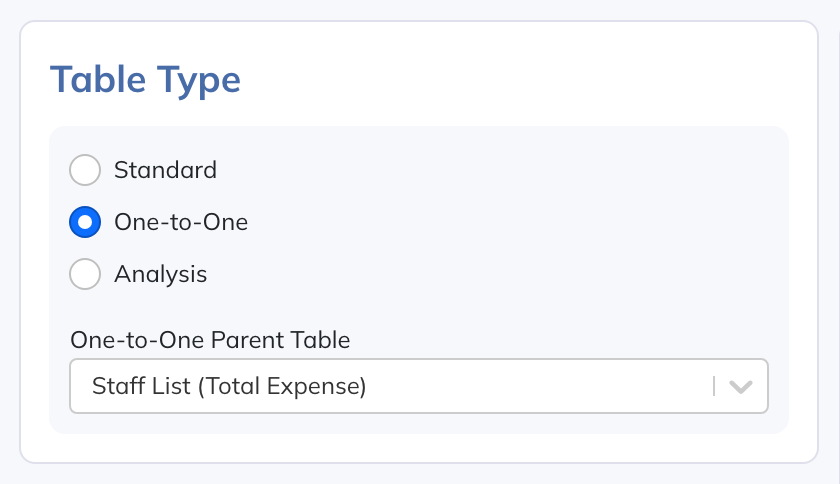
A One-to-One table holds another measure for the items of a Standard table. Select One-to-One under Table Type, then choose the Standard table in One-to-One Parent Table. It offers the same settings as a Standard table.
Its rows are the parent’s rows: the same items, labels, order, and IDs. Adding, deleting, reordering, or renaming items in the parent updates every One-to-One table. Maintain the item list only in the parent.
In a table-level formula, a reference to the parent or to another of its One-to-One tables reads the same item’s row. See Table-Level Formulas.
Analysis Collection Tables
An Analysis table summarizes another table by a category, such as product sales by channel.
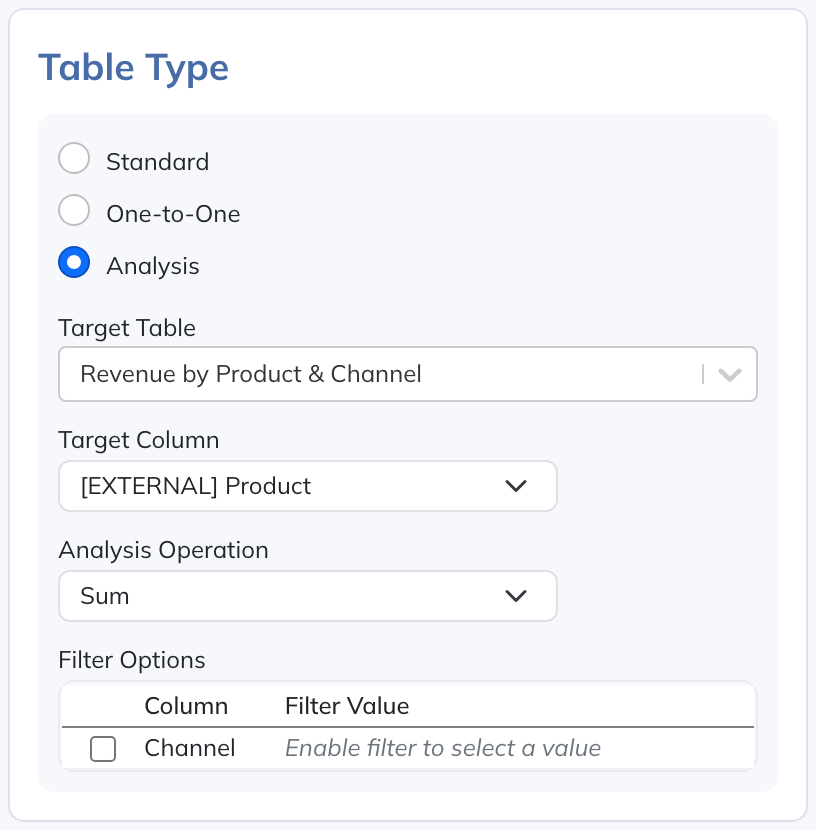
- Target Table is the table to summarize: a Standard, One-to-One, or Analysis table.
- Target Column is the List or True/False column to group by. Columns inherited from related tables are marked [EXTERNAL].
- Analysis Operation is Sum, Average, Count Nonzero, Count New Nonzero, or Count New Zero. These work like the Aggregation Lines above, within each group.
- Filter Options optionally limit which rows are included, using the Target Table’s List and True/False columns.
The table has one row per entry in the List column’s list, in that list’s order. A True/False column produces a True row and a False row, which you can rename with True Label and False Label.
An Analysis table can target another Analysis table, so rollups can cascade:
- A Revenue table forecasts revenue by customer and SKU, with a Customer List column and a SKU List column.
- Revenue by Customer is an Analysis table that targets Revenue and groups by Customer.
- Revenue by Distributor targets Revenue by Customer and groups by a Distributor List column in the customer list. Each layer builds on the one before it.
Multi-Entity Combination Tables
A Multi-Entity Combination table combines the rows of Collection Tables from several entities into one table, such as each entity’s personnel table in one company-wide roster. It is available only in multi-entity companies.
Select Multi-Entity Combination under Table Type. In Tables to Include, click + Add Table, then choose the Entity and the table to include. Drag lines to change the order in which included tables appear, and use a line’s delete icon to remove it.
To combine a column, create a User-Defined Column on the combined table. Its settings show a Column Mapping section that lists each included table with a Column to Map Here choice; only columns of the same type are offered. For example, map each entity’s Division column into one Division column.
User-Defined Columns
User-Defined Columns hold attributes of each item, such as a department, a title, or an annual salary. In Edit Table Settings, click + Add Column, enter a Column Name, and choose a type:
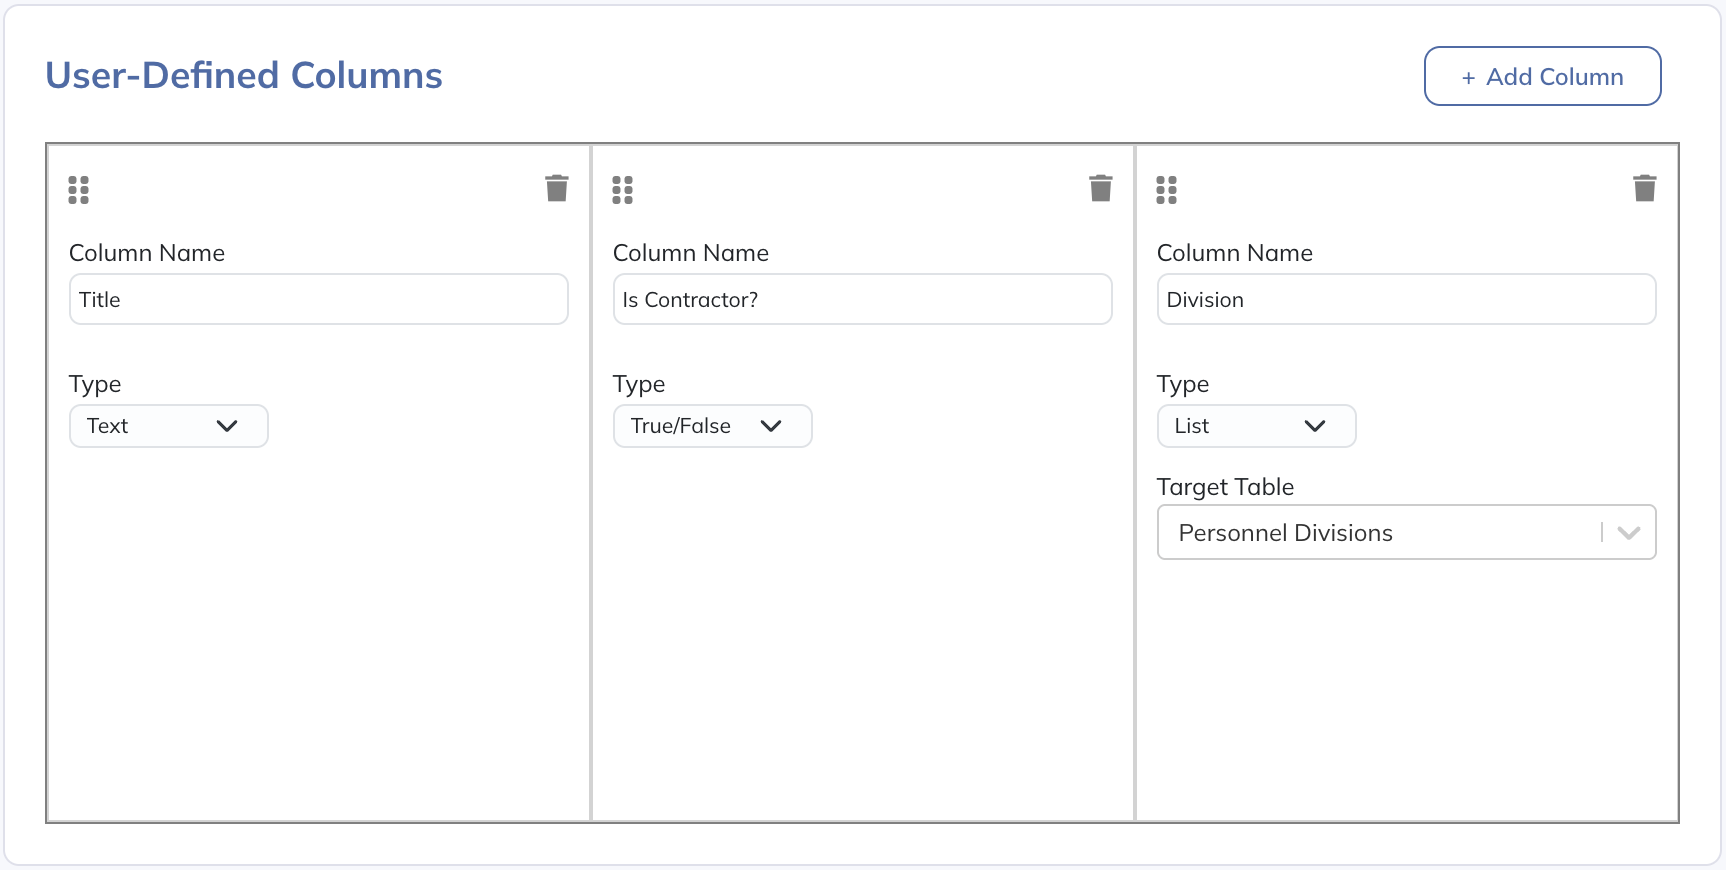
- Number: A numeric value, with a choice of formats.
- Text: Free text, such as a job title.
- List: One entry from another table, chosen in the column’s Target Table. For example, each employee’s department. Any table except an Analysis or One-to-One table can serve as the list; a table with Exclude Timeseries? checked is the usual choice.
- True/False: A checkbox, such as whether an employee is a contractor.
Formulas can use these columns through three tools in Edit Formula. Column Lookup and Row Lookup are available in Standard and One-to-One tables.
| Tool | Returns | Example for an Employee |
|---|---|---|
| Column Reference | The item’s own column value | The employee’s Annual Base |
| Column Lookup | A column value in the related table, found through a List or True/False column | The Raise % column of the employee’s Division in a Divisions table |
| Row Lookup | A time-series row in the related table, found the same way | The by-period row for the employee’s Division |
List and True/False columns also drive Sub-Table filters and Analysis tables.
Table-Level Formulas
Write a table-level formula for one item, and Modeloptic runs it for each item. References to related tables read the row of the item being calculated.
In a Standard or One-to-One table, Use Formula for Historicals at Table Level?, Use Formula for Projections at Table Level?, and a Formula aggregation option replace row-by-row settings with one formula for every item.
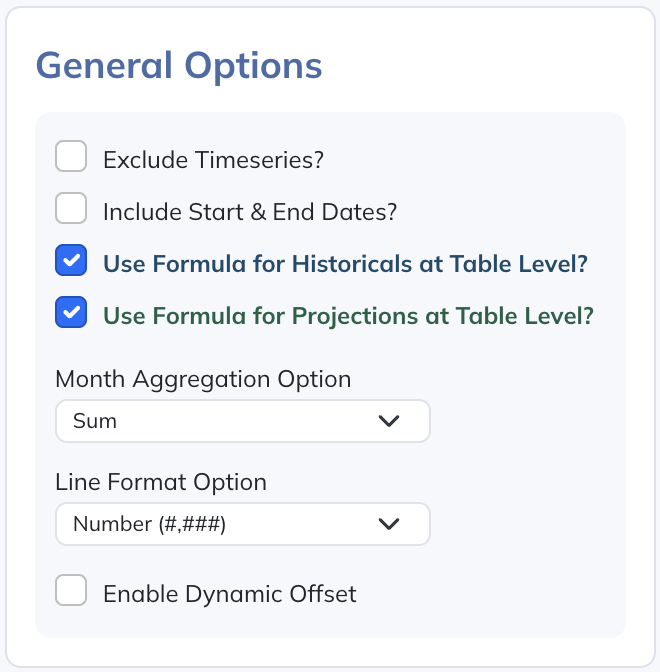
The table-level formulas appear above the table. Click one to edit it:

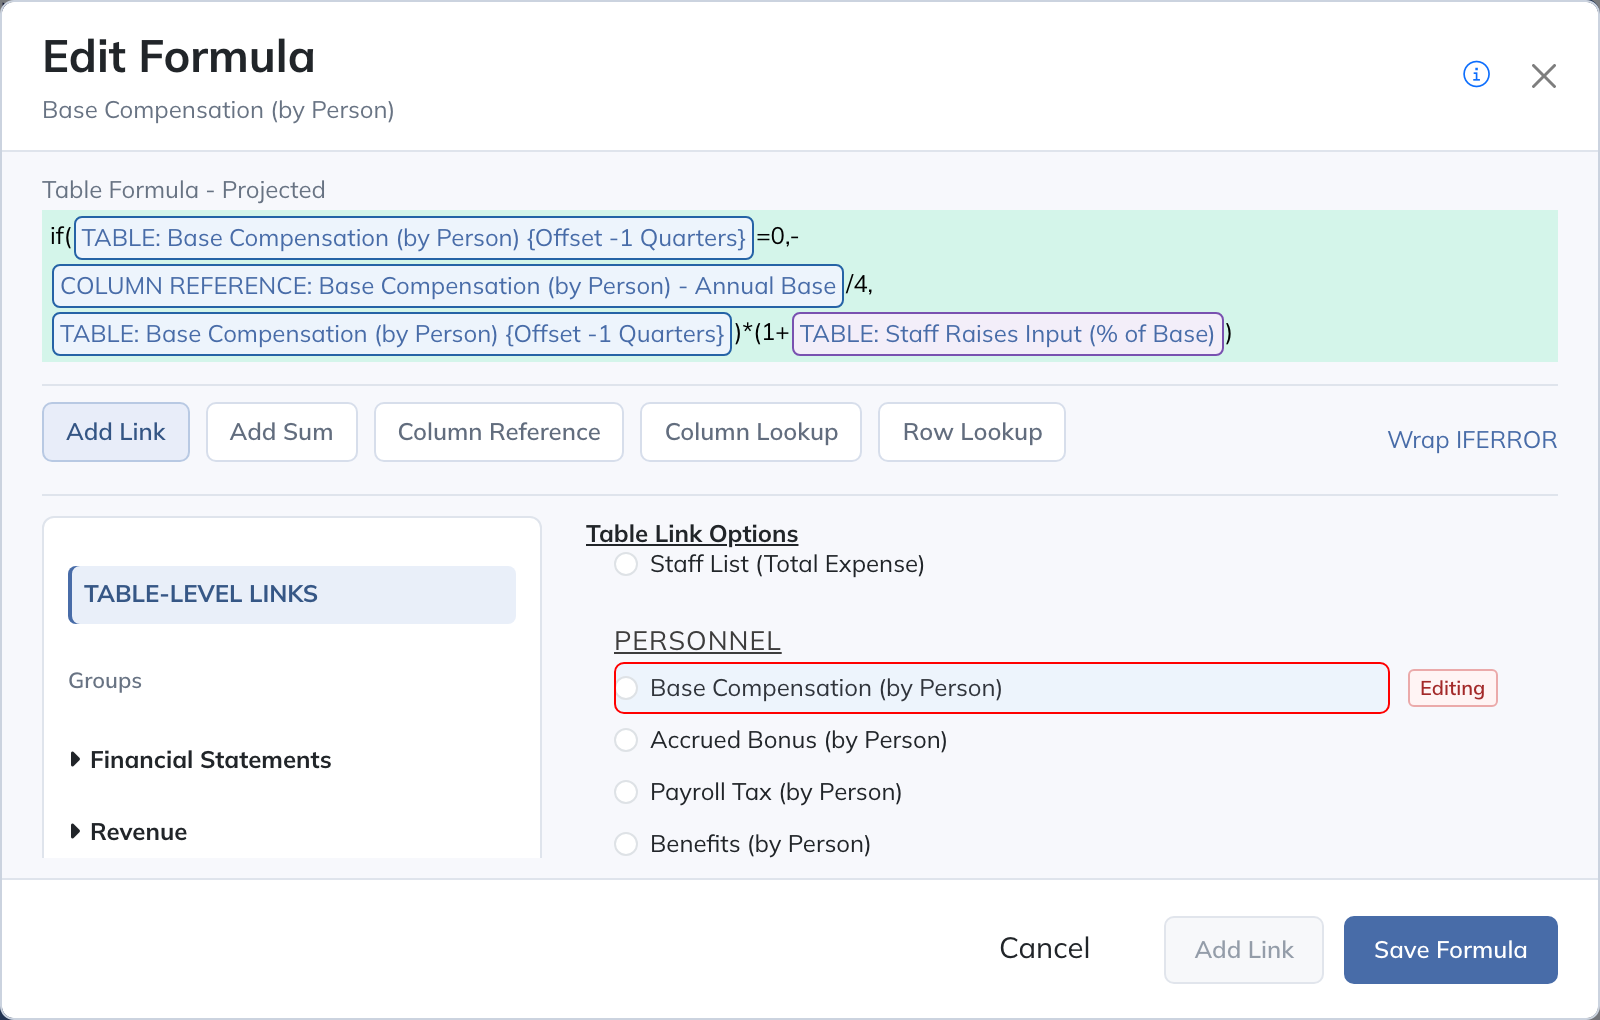
Edit Formula works as it does for a single row, with a TABLE-LEVEL LINKS section on the left that lists the related tables. A reference to the parent or to another One-to-One table reads the same item’s row, and a Column Reference reads the item’s own column value. In the example, one formula calculates every person’s compensation from that person’s own values.
List-Scoped Views
A List-Scoped View shows one item of a Standard Collection Table at a time, such as one employee or one product. Choose the item with Active Item, and the View recalculates for that item.
Use it to inspect or edit a single item’s build. It is not where per-item calculations are stored:
- To add a calculation that runs for every item, click + List-Scoped Row & Sub-Table. This creates a One-to-One table and shows its row for the Active Item. See below.
- A row added with + Logic Row holds a single series that changes as you switch items. Nothing outside this View can reference it, and it is deleted with the View.
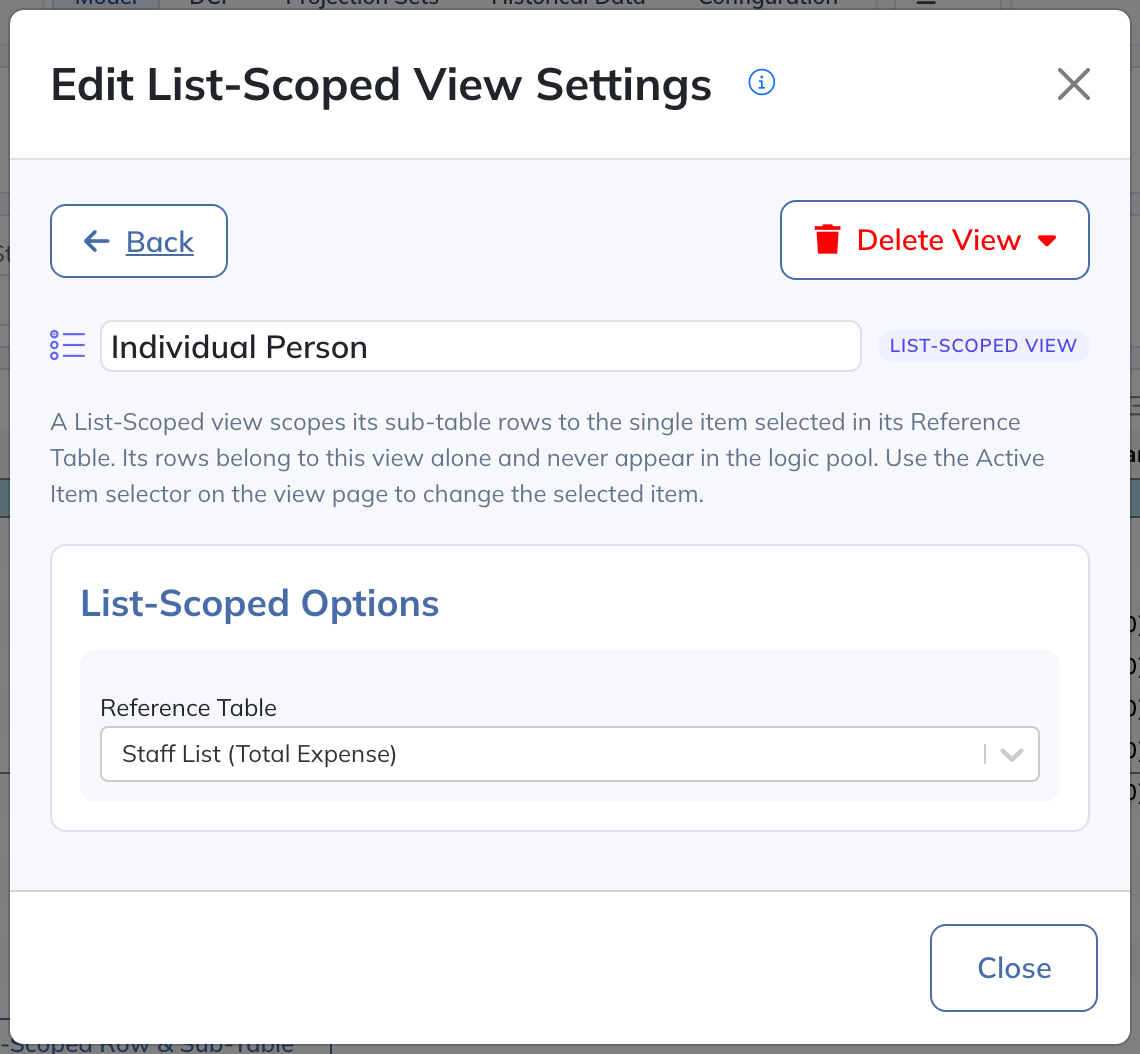
Create a List-Scoped View with + List-Scoped View in a model navigation group in Edit mode, then choose the Standard table in Reference Table under List-Scoped Options:
Active Item appears at the top of the View, followed by the selected item’s User-Defined Columns, which you can edit in place:

How its rows calculate:
- A Sub-Table of the Reference Table, or of one of its One-to-One tables, shows the Active Item’s row.
- A Sub-Table of a table with a List column pointing at the Reference Table sums the rows whose value in that column is the Active Item.
- Any other Sub-Table shows all its rows, as in any View.
- A row added with + Logic Row calculates one series. It depends on the Active Item only through the Sub-Table rows it references.
The View’s rows belong to it alone. They never appear under Logic Rows, can’t be placed in another View, and are deleted with the View. Only formulas in the View’s own rows can reference them; other formulas, including table-level formulas, can’t. A List-Scoped View has no separate global setting; it follows its Reference Table.
To add a new per-item calculation from inside the View, click + List-Scoped Row & Sub-Table:

This creates a One-to-One table named [New Table], with the Reference Table as its parent, in the View’s navigation group. It adds a Sub-Table row for that table to the View and opens the table’s Edit Table Settings so you can name and configure it.
In Advanced Mode, the Sub-Table Option column chooses each row’s table, and the gear beside it opens that table’s settings:
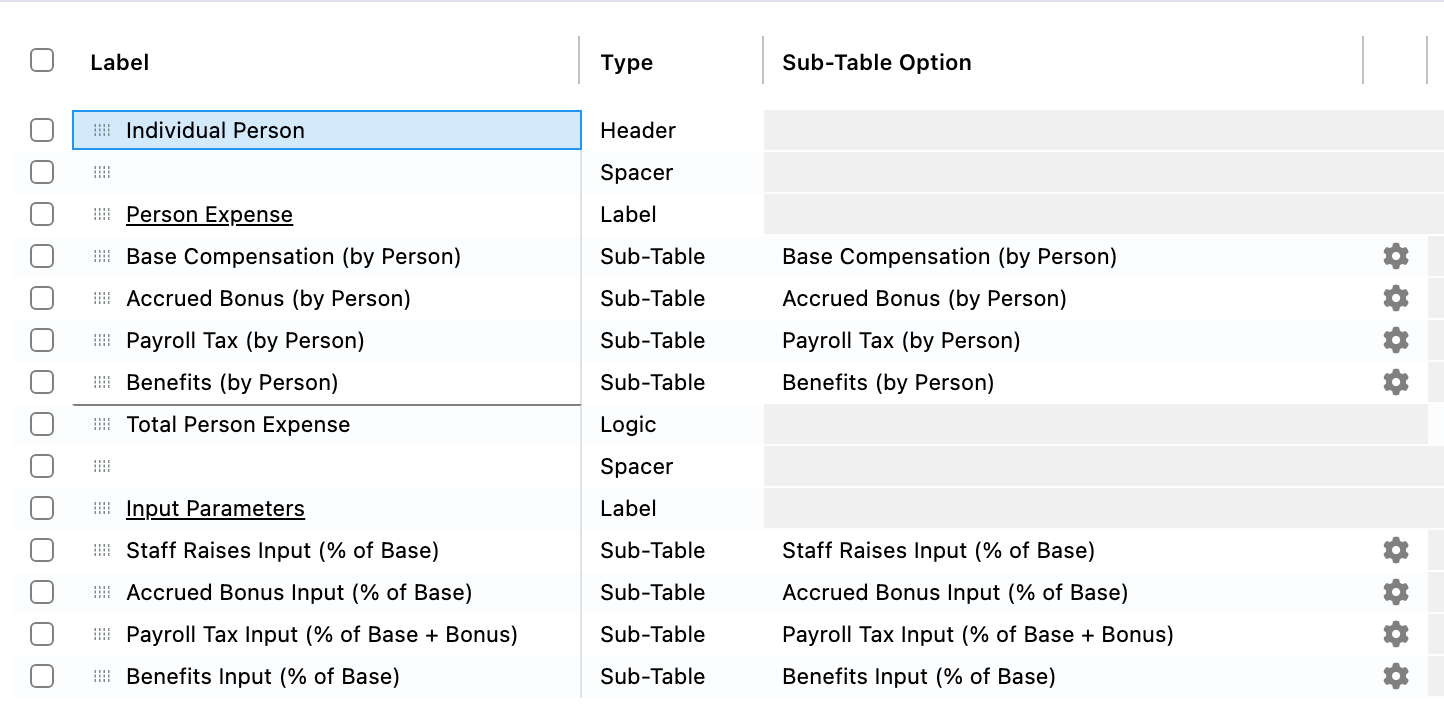
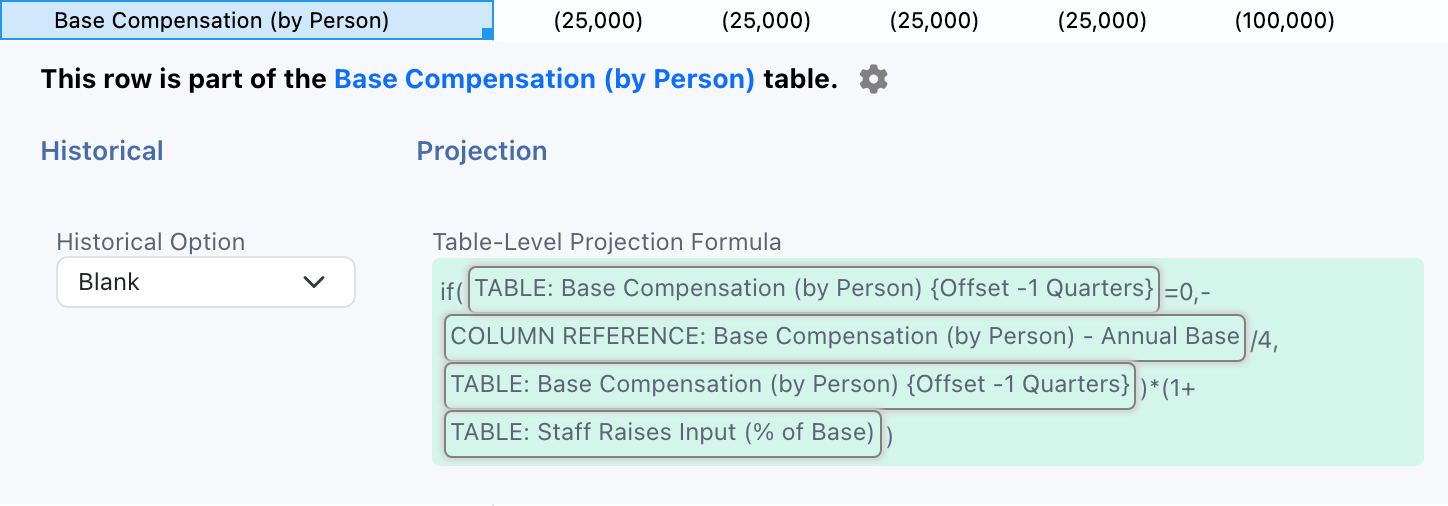
In Basic Mode, click a Sub-Table row’s label to expand it. The table name opens the Collection Table, and the gear opens its settings. In the example below, Base Compensation’s table-level projection formula runs for the person selected in Active Item.
Dynamic Offsets
A Collection Table Dynamic Offset shifts formula references by a number of periods that can differ by item, such as each customer’s payment terms. Standard and One-to-One tables support it.
Setting Up the Offset
In Edit Table Settings, check Enable Dynamic Offset under General Options, then choose how offsets are set:
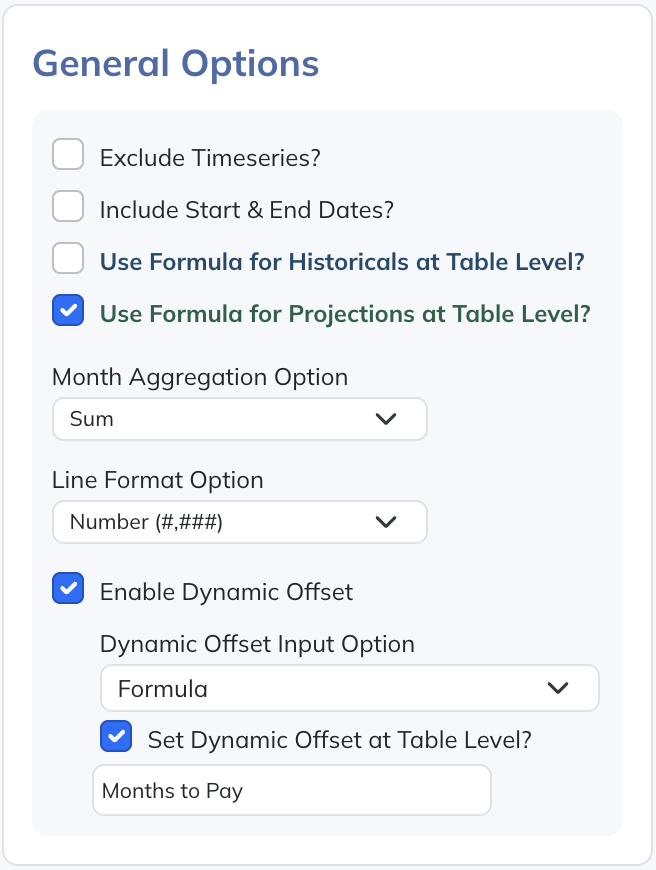
- Dynamic Offset Input Option: Hardcode to enter each offset, or Formula to calculate it.
- Set Dynamic Offset at Table Level? One input or formula for the whole table, instead of one per item.
- Dynamic Offset Label: An optional name, such as Months to Pay, that replaces “Dynamic Offset” in column headers and inputs.
Where you enter offsets depends on those choices:
| Hardcode | Formula | |
|---|---|---|
| Per item | Enter a whole number for each item in the offset column in Advanced Mode, or in the item’s Dynamic Offset Input. | Write a formula for each item in the offset formula column in Advanced Mode, or in the item’s detail. |
| Table level | Enter one number above the table for every item. | Write one formula above the table. It is calculated separately for each item, so every item follows the same rule with its own data. |
Negative offsets look back, so a two-month payment lag is -2, even in a column labeled Months to Pay. If each contract stores its Months to Pay as a positive number, a table-level formula can return its negative, found with Column Lookup.


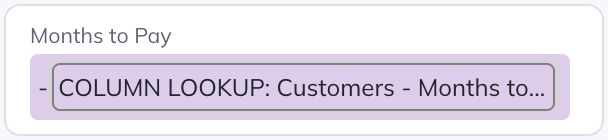
Each item’s offset is one whole number that applies to every period. A formula result that is not a whole number is rounded to the nearest whole number.
Using the Offset in a Formula
In a historical or projection formula, select the reference you want to shift and check Use Dynamic Offset in the footer. The reference then uses the offset of the item being calculated. Offsets are measured in periods of the company’s Period Resolution.
The rules for shifted references, and a comparison with offsets on individual Logic Rows, are in Row-Level Dynamic Offsets.
Personnel Presets
Presets generate a complete, editable set of Collection Tables and Views for common builds. Open Model Navigation, select Edit, and expand Generate Personnel Structure below your groups:
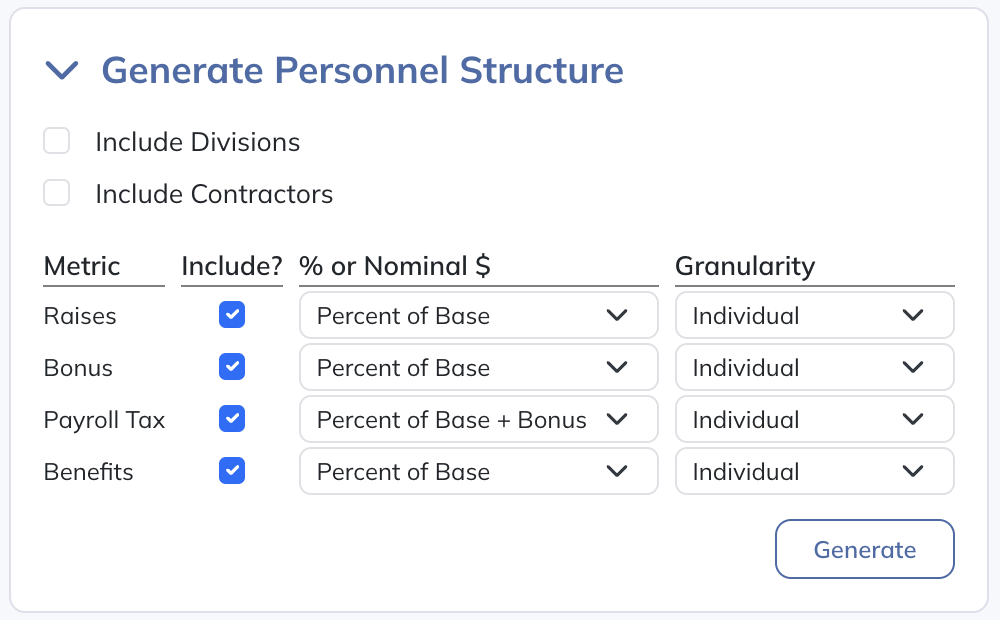
- Include Divisions adds a Division classification, so assumptions such as raise percentages can differ by division.
- Include Contractors adds a contractor flag. Flagged employees are excluded from Bonus, Payroll Tax, and Benefits.
- Raises, Bonus, Payroll Tax, and Benefits: check Include? for each expense to generate. Under % or Nominal $, choose Percent of Base (Payroll Tax: Percent of Base + Bonus) or Nominal $ Amount. Under Granularity, choose Global for one company-wide rate, Division for a rate per division (with Include Divisions), or Individual for a rate per person. Here, Global is unrelated to sharing across Projection Sets.
Click Generate to add a Personnel model navigation group, then enter your staff and assumptions. With the default options, the group contains:
- A Personnel Overview View.
- A Staff-Level Expenses sub-group with Staff List (Total Expense), Base Compensation (by Person), Accrued Bonus (by Person), Payroll Tax (by Person), and Benefits (by Person).
- An Additional Inputs sub-group with the raise, bonus, payroll tax, and benefits rate tables.
- An Individual Person List-Scoped View.
Include Divisions adds a Personnel Divisions table and a Division-Level Expenses sub-group of Analysis tables. Generating again creates a second, independent copy rather than updating the first.
Revenue Presets
Below Generate Personnel Structure in Model Navigation Edit mode, Revenue Build Presets offers starting structures for revenue. Each preset has its own Generate button, and generating one again creates another copy:
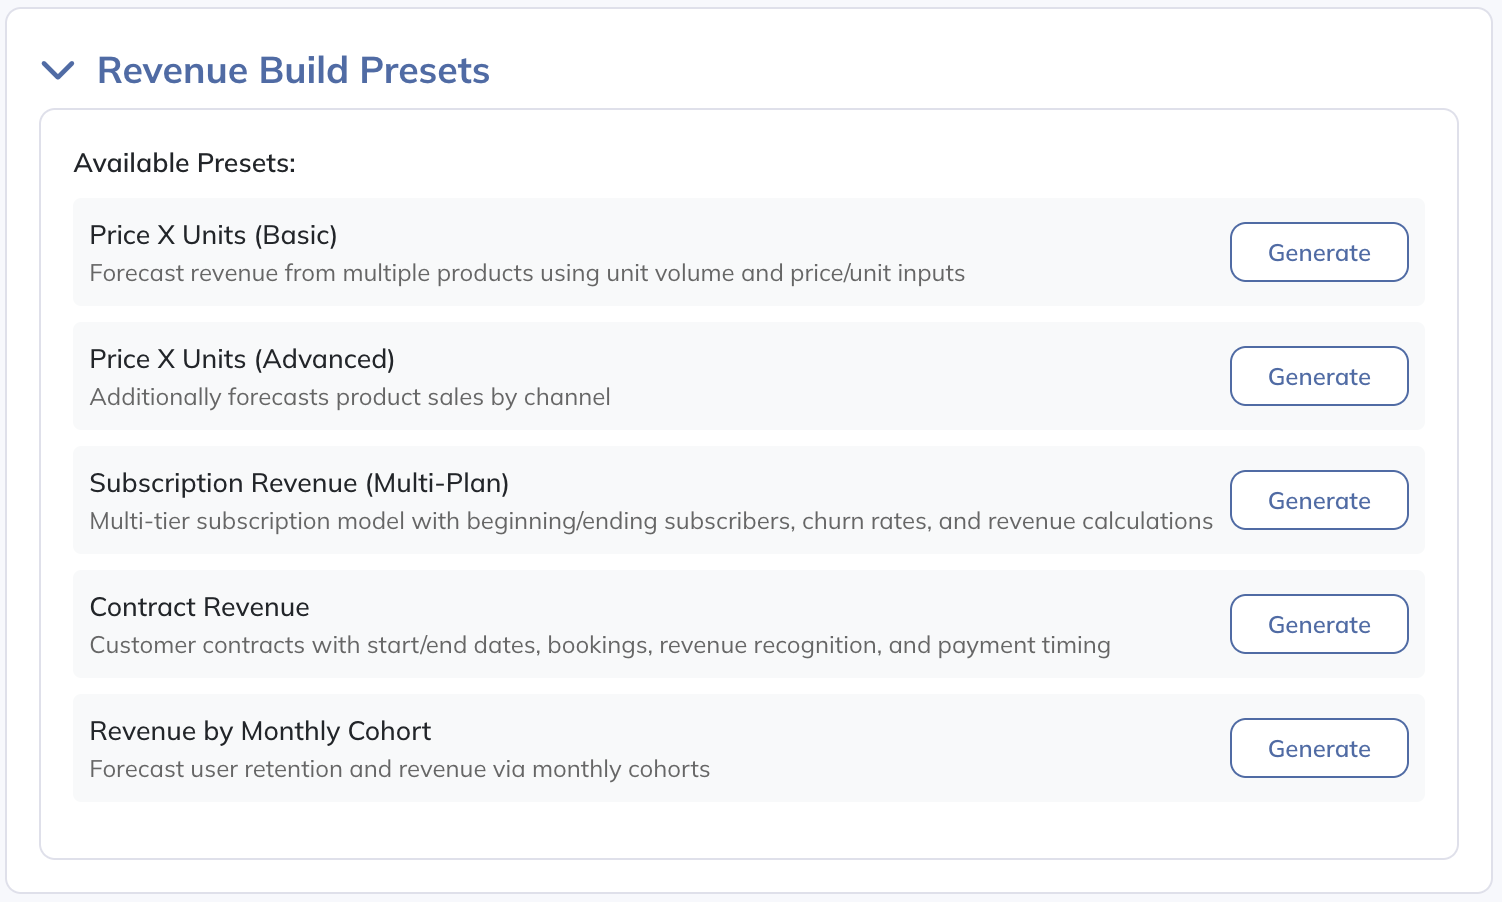
- Price X Units (Basic): for one price and volume per product. Enter units sold by product in the Units Sold table and price per unit in the Price/Unit table. Maintain the product list in the Products table.
- Price X Units (Advanced): for products sold through several channels. It adds Channels and Product & Channel Combinations tables. Forecast units and prices in the Unit Sales by Product & Channel and Price/Unit tables; Analysis tables and List-Scoped Views in the group summarize the results.
- Subscription Revenue (Multi-Plan): for recurring revenue by plan tier. Forecast subscribers by tier in the Subscriber Calculations tables, with churn in the Subscription Inputs table and prices in the Subscription Price / Tier table. Revenue appears in the Subscription Revenue / Tier table, and the Individual Subscription Tier List-Scoped View shows one tier at a time.
- Contract Revenue: for contracts with payment terms. Define customers and their Months to Pay in the Customers table, and contract amounts in the Contract Amount column of the Contracts (Bookings) table. The Individual Contract List-Scoped View shows the timing of bookings, revenue, and payments.
- Revenue by Monthly Cohort: for user cohorts with retention. Enter cohorts and their Starting # of Users in the # of Active Users table, retention in the Cohort Inputs table, and revenue per user in the Revenue / User table. The Individual Cohort List-Scoped View shows one cohort at a time.
Collection Table Excel Import
Use Excel import to update a table’s items from a spreadsheet, such as a staff list from your payroll system. It is available for Standard and One-to-One tables. It updates item labels, start and end dates, dynamic offsets, and User-Defined Columns; it never imports period values. Use Historical Data imports for actuals and Flat Forecast Upload for statement forecasts.
At the bottom of Edit Table Settings, click Download Template, edit the workbook, then click Upload Data from Excel:

- Click Download Template. Download a fresh template each time.
- Edit the workbook, keeping its sheet layout and column headings, and following the rules below.
- Click Upload Data from Excel and choose the file.
- A confirmation lists how many lines will be added, updated, or deleted. Check it before proceeding.
- Review the resulting rows and dependent calculations, then click Save Projections.
Rules for the Template
- IDs: keep each existing item’s ID. Never reuse or duplicate an ID; duplicate IDs stop the upload.
- Standard tables: add a row with a blank ID to add an item. Delete a row to delete that item; its rows in every One-to-One table of the Standard table are deleted too.
- One-to-One tables: a One-to-One table shares its parent Standard table’s items, so the same rules apply: add a row with a blank ID to add an item, and delete a row to delete that item from the parent Standard table and all of its One-to-One tables.
- List columns: values are matched to the list by exact label. A value that matches no label is ignored without an error: an existing item keeps its previous value, and a new item gets none. A blank cell clears the value.