
Logic Rows & Views
Overview
Build a model by creating Logic Rows and placing them in Views. For how rows, Views, placements, and Collection Tables fit together, start with Model Structure & Navigation.
| To do this | Go to |
|---|---|
| Add a new line to a View | Adding a Logic Row to a View |
| Set how a row calculates | Historical Options, Projection Options, Aggregation Options |
| Show the same calculation in another View | Reusing a Row with Update Reference |
| Make a copy you can edit separately | Cloning, Removing & Deleting |
| Try different assumptions for the same row | Projection Sets |
| See what a row feeds and where it appears | Where Is This Row Used? |
| Show a Collection Table’s rows in a View | Sub-Tables |
| Share rows and Views across Projection Sets | Global Tables, Views & Rows |
These instructions apply to Logic Rows and Standard Views. Financial-statement rows are managed from your chart of accounts, and List-Scoped Views have rows of their own.
Logic Rows
A Logic Row defines one line of your model, such as Units Sold, Revenue, or Ending Headcount. It holds the inputs or formulas that determine the line’s values across periods, along with its historical, projection, aggregation, and number-format settings.
A Logic Row can be an assumption you enter directly, a calculation based on other rows, or a metric loaded from external data. Click its label in a View to expand the row detail and edit its settings.
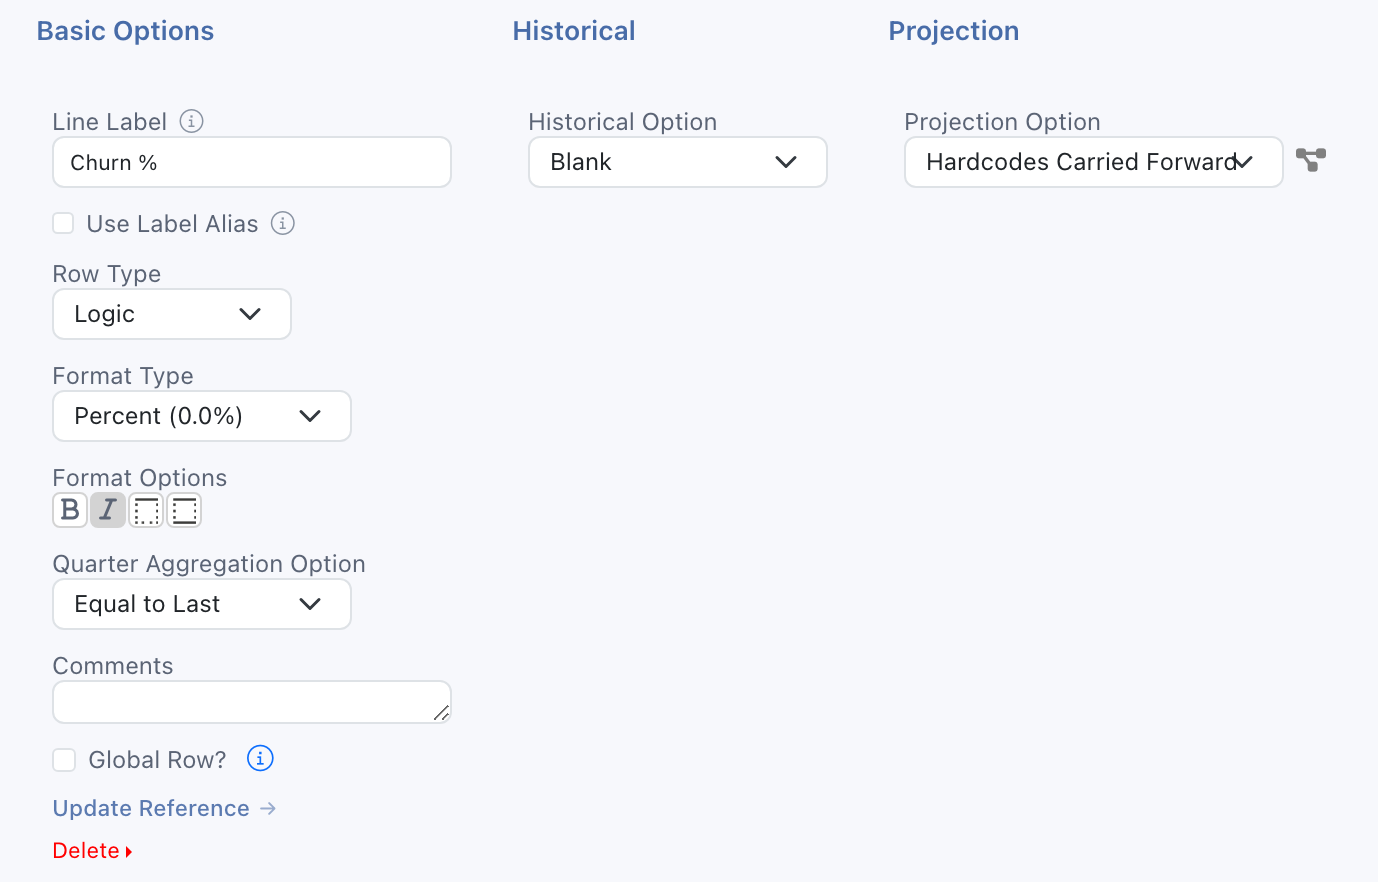
A Logic Row exists independently of any View, and a formula that references it points at the row itself. Moving or removing a placement never changes a formula. Formulas can also reference Collection Table rows and aggregations, user-defined columns, or system values.
Reusing a row in another View and sharing it across Projection Sets are separate choices. Reuse adds another placement of the same row. The global setting determines which Projection Sets it exists in.
Views
A View is an editable page of Logic Row placements, headers, labels, spacers, and Sub-Tables. It controls which lines you see, their order, and their visual styles. The calculations belong to the Logic Rows it displays.
To create a Standard View, open Model Navigation, select Edit, then choose + View (Free Form Logic) in a model navigation group. Open the View to add and arrange its rows.
For the same entity, Projection Set, and period, every placement of one Logic Row shows the same value. Changing that row’s input or formula from one View updates its other placements. To show different assumptions, use a different Projection Set or deliberately clone the row.
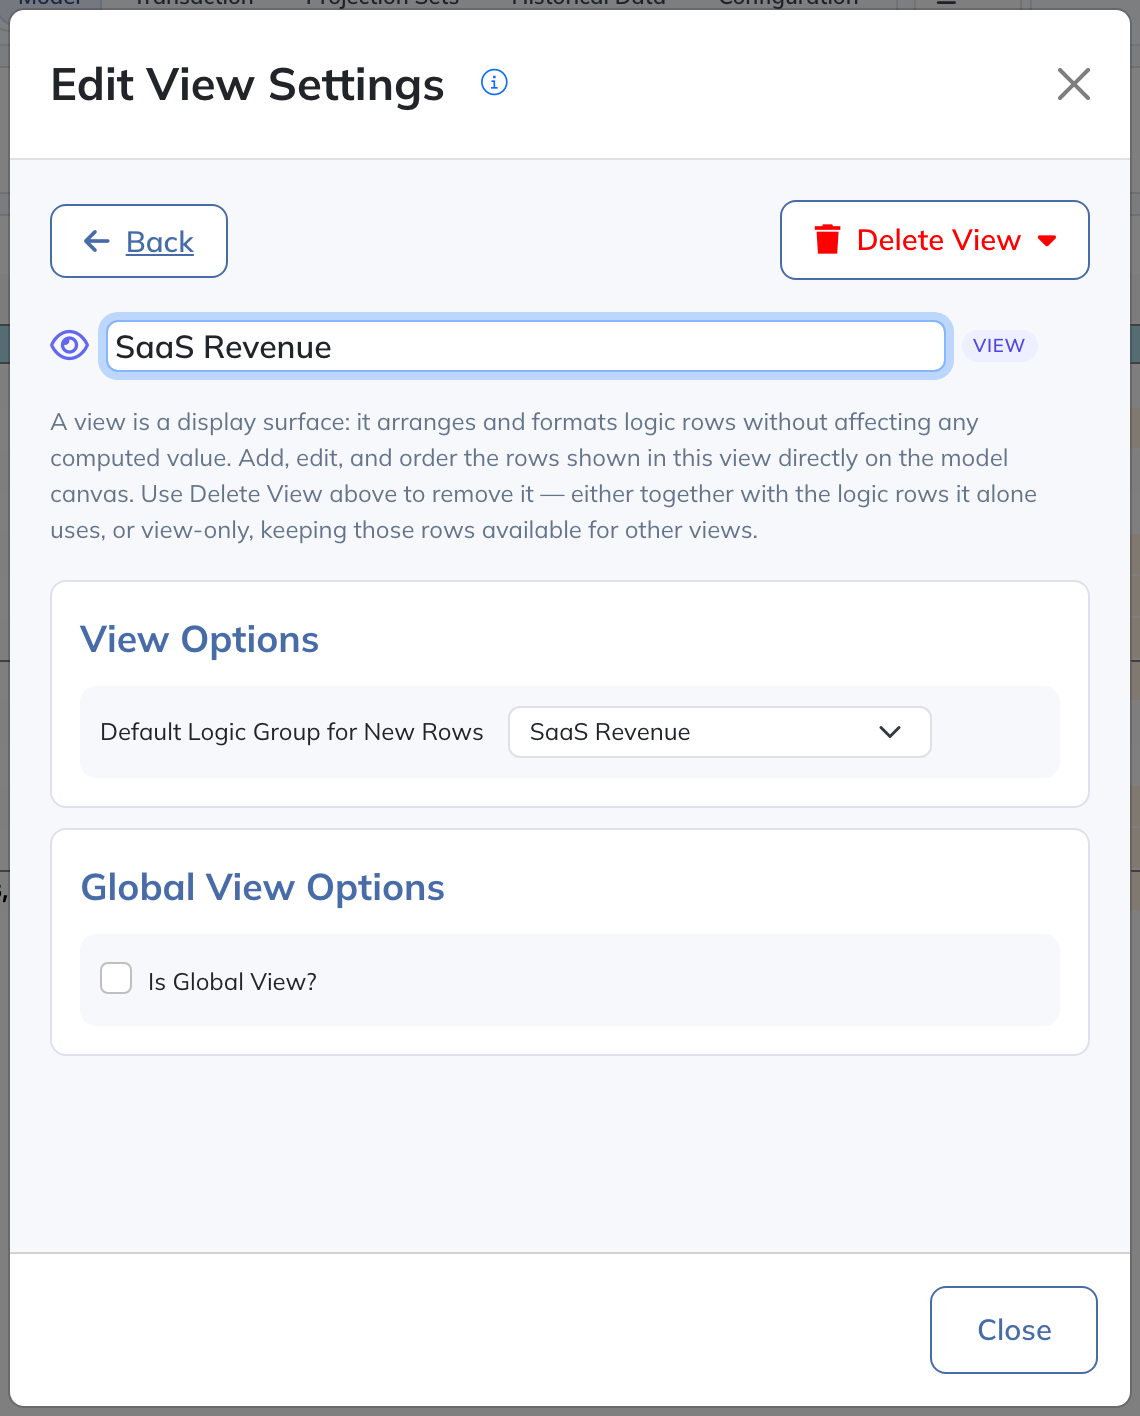
The View’s settings let you rename it, choose its Default Logic Group for New Rows, and, with admin access, make it global. A global View has the same layout across Projection Sets; the rows’ forecast values can still differ by set.
Adding a Logic Row to a View
- Open the View and select + Logic Row at the bottom. This creates a new Logic Row with a placement in the View.
- Click the row label to open its detail. Set Line Label, choose a Projection Option, and enter the assumptions or formula. Set historical and aggregation options as needed.
- Add + Header, + Label, or + Spacer rows to organize the build, then click Save Projections.

Show a Row That Already Exists
A new row with the same label is a separate calculation, not a copy. To show an existing Logic Row, add a placement of it with Update Reference. It is the only way to reuse a row:
- Select + Logic Row. This adds a placeholder row.
- Expand the placeholder and select Update Reference.
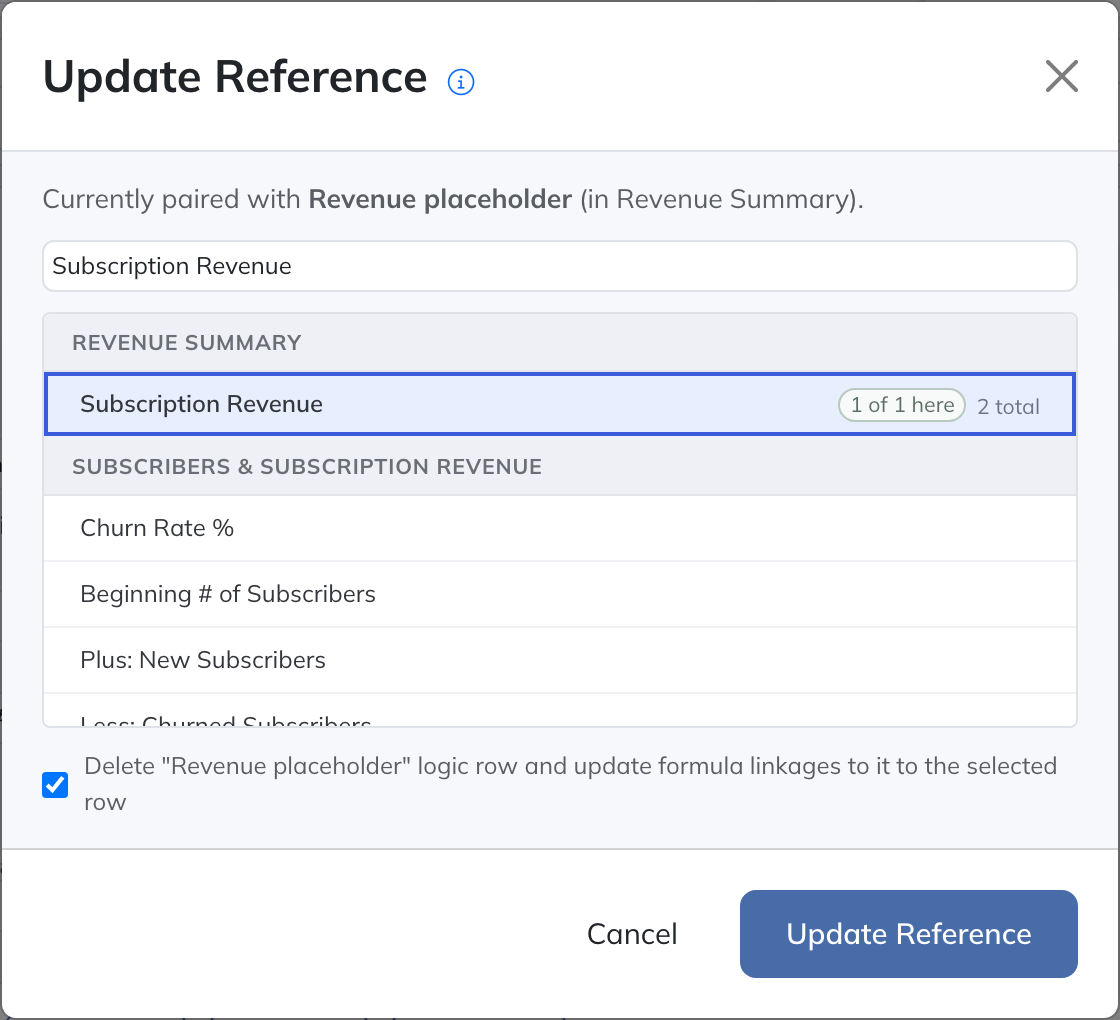
- Choose the existing row. Leave Delete “…” logic row and update formula linkages to it to the selected row checked so the placeholder is deleted, then click Update Reference.
- Click Save Projections.
The View now displays the same row as every other View that places it. Edit the row in any of them and every placement updates.
Logic Row Groups
Open Logic Rows in Model Navigation to find Logic Rows by Logic Row Group, including rows that have no placement in any View. A Logic Row Group organizes the rows themselves; a model navigation group organizes Views and Collection Tables.
Open a Logic Row Group to edit its rows directly. In Edit mode, you can create and reorder groups, add rows, and move rows between groups. Moving a row between Logic Row Groups changes its organization without changing its calculation or its placements.
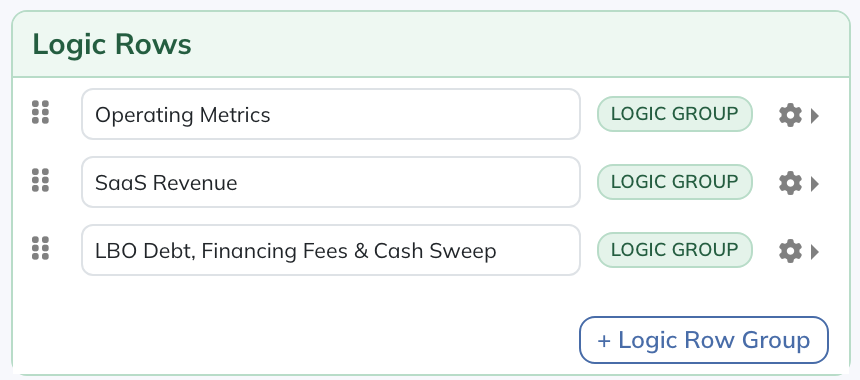
New rows added from a View go into the View’s Default Logic Group for New Rows. Rows without an assigned group appear in Unassigned, which cannot be renamed or deleted. Logic Row Group organization is specific to the selected Projection Set, even when some of its rows are global. Moving a global row to another group in Base Case leaves it in its old group in Upside Case, and adding, renaming, or reordering groups affects only the selected set.
Financial-statement rows and List-Scoped View rows are edited through their own Views and do not appear here.
Line Types
Each line in a View has a type. Headers, labels, and spacers exist only in that View and contain no calculation.
- Logic: A placement of a Logic Row.
- Header: Bold text with top and bottom borders and a shaded background, for grouping related rows.
- Label: Underlined text that labels the rows below it.
- Spacer: A blank line.
- Sub-Table: A Logic Row set to display a Collection Table’s rows, with optional filters. The rows stay in the Collection Table. See Sub-Tables.
Basic Mode has two controls for this. Row Type chooses what a calculating line does: Logic or Sub-Table. Line Type chooses what a non-calculating line looks like: Header, Label, or Spacer. Expand the line to find the control that applies. In Advanced Mode, the Type column covers all of them.
Headers, labels, and spacers can switch among themselves, and a Logic line can switch to Sub-Table and back. A Logic line can’t become a header, label, or spacer.
Line Format & Styles
The Logic Row’s number format determines whether values appear as numbers, currencies, percentages, or multiples and how many decimals are shown. It follows the row into every View. Currency formats use the company’s presentation currency.
Styles such as bold, italic, and borders belong to the placement in a View. Use them to emphasize a total in one View without changing how the same row is presented elsewhere.
Formats and Display Units
Three rules determine the value a formula uses:
- A Logic Row’s number format never rescales values. A row that shows 25 stores 25.
- Collection Tables and user-defined Number columns also offer thousands and millions formats, such as 000s (Show in Thousands). These change only what is displayed; formulas use the stored value.
- Financial-statement values are stored in your Display Units. When Display Units in Company Configuration is Thousands, a statement value of 1,200 is stored as 1,200 and means 1,200,000.
A formula that links a whole-dollar operating calculation into a statement must therefore convert it. With Display Units set to Thousands, link Headcount × Salary per Employee as (Headcount × Salary per Employee) / 1,000. With Millions, divide by 1,000,000.
Historical Options
Historical Option sets where the row’s historical values come from. Blank leaves history empty. Formula calculates history from other rows, for example a historical margin from historical revenue and gross profit. External Data fills history from a data connection, as described in Historical Data.
The choices depend on the row:
| Row | Choices |
|---|---|
| Logic Row | Blank or Formula |
| Logic Row with Global Row? checked | External Data or Formula |
| Collection Table row in a global table with a Global Table Type of Full | External Data or Formula |
| Income Statement account row | Formula is the only choice shown, but there is nothing to enter: history comes from your imported financial statements. |
| Row you add to the Income Statement | Formula only. Enter a Historical Formula. |
| Row in a List-Scoped View | Never External Data |
Data connections can only fill global rows. To load actuals into a Logic Row, check Global Row? first, then choose External Data and map a data connection to the row.
With Formula selected, click Historical Formula to open Edit Formula. See Writing Formulas for the available references and functions.
Projection Options
Projection Option determines the row’s forecast values. Choose a method to match how you want to enter or calculate the forecast:
| Option | What It Does | Use It For |
|---|---|---|
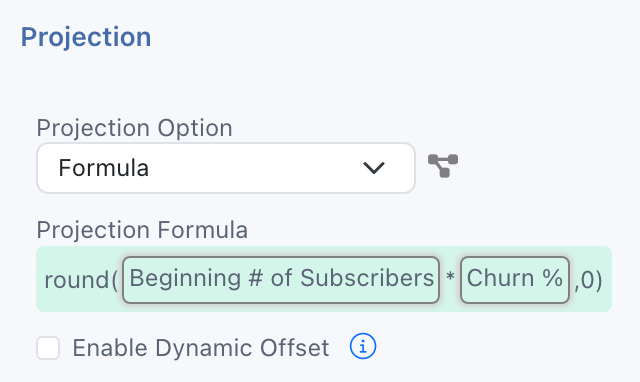
| Formula | Calculates each period from other rows. Open Edit Formula to choose sources and write the calculation. | Calculated lines, such as Revenue = Units × Price |
| Hardcodes | You enter a value for each forecast period. | Inputs that change period to period, such as a monthly budget |
| Hardcodes - Carried Forward | You enter a value in a forecast period, and it carries forward until the next period with an entry. | Inputs that change occasionally, such as a price that holds until changed |
| Trailing Average | Sets every period of the first projection year to the average of the last historical periods chosen in Trailing Average Period; the choices follow the company’s Period Resolution. With Trailing Average Future Year Growth Rate %, each later year steps up by that rate, compounding. | Items expected to continue at a recent run rate |
| Flatline | Sets each projected period equal to the latest historical period’s value. | Items expected to stay at the latest actual |
| Split by Period | Breaks the forecast into sub-periods, each with its own method. See Split by Period. | Different methods for different stretches, such as hardcodes for the rest of this year and a formula after |
With Formula selected, click Projection Formula to open Edit Formula. See Writing Formulas for details.
Aggregation Options
The Aggregation Option controls how the periods of your company’s Period Resolution combine into larger displayed periods, such as months into quarters and years or quarters into years. Its label follows the Period Resolution: Month Aggregation Option or Quarter Aggregation Option. Annual models don’t show it. Sum is the default.
- Sum: Adds the periods. Use it for flows such as revenue.
- Average: Divides the total by the number of periods in the larger period: 3 months in a quarter, or 12 months or 4 quarters in a year. Blank periods count as zero.
- Equal to Last: Uses the last period’s value. Use it for balances such as ending headcount.
- Beginning Balance: Uses the first period’s own value. It does not look back to the prior period’s closing value, so on a row of ending balances it returns the first period’s ending balance.
- None: Leaves larger periods empty.
- Formula: Calculates the larger period from other rows’ aggregated values. For a margin, divide aggregated gross profit by aggregated revenue; this gives the margin for the whole period instead of summing or averaging period margins.
Aggregation changes how a row is calculated for larger displayed periods. It does not change the company’s Period Resolution or the forecast method for each period.
Reusing a Row with Update Reference
Use Update Reference to make a line in your View display an existing Logic Row. This adds a placement of that row, reusing its inputs, formulas, and results; it does not create a second calculation.
- Open the target View and add a Logic Row as a placeholder, or expand the placement you want to change.
- Select Update Reference. In Advanced Mode, it is the link icon in the row. Search by label or alias; the list shows placements grouped by View, followed by rows with no placement under their Logic Row Group.
- Select the existing Logic Row. If the row being replaced has no other placement, the dialog shows Delete “…” logic row and update formula linkages to it to the selected row, checked each time the dialog opens. Set it using the table below. If the row being replaced has other placements, the option doesn’t appear and the row is always kept.
- Click Update Reference, then Save Projections.
| You are | Delete option | Result |
|---|---|---|
| Replacing a placeholder you just added | Leave it checked | The placeholder row is deleted, and any formula that referenced it now references the selected row. |
| Swapping out a row that has real inputs or formulas | Clear it | The old row is kept, with no placement, in its Logic Row Group. Every formula that references it is unchanged. |
The delete option updates formula links in Logic Rows and Collection Tables in the current Projection Set, and in transactions that use that Projection Set. It does not update other Projection Sets or DCFs. If the old row is global, deleting it removes it from every Projection Set, and references to it there break. Check the dependency map first, or clear the option.
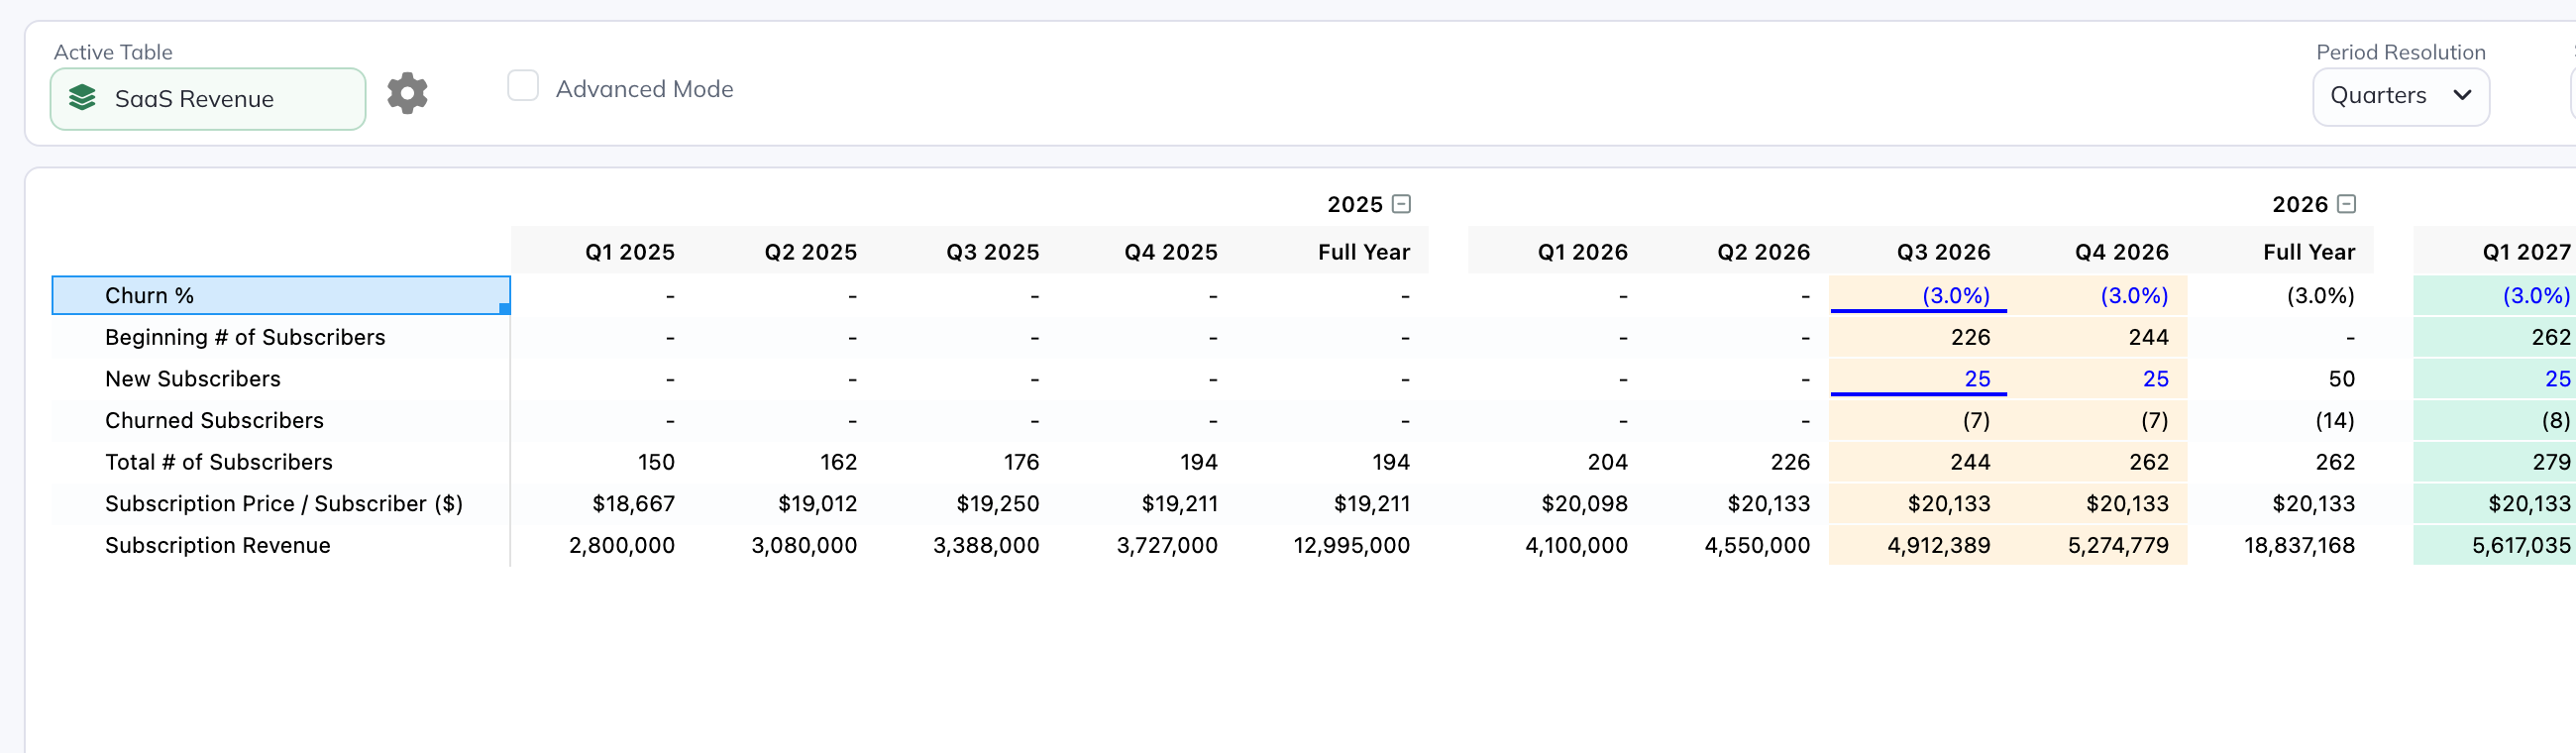
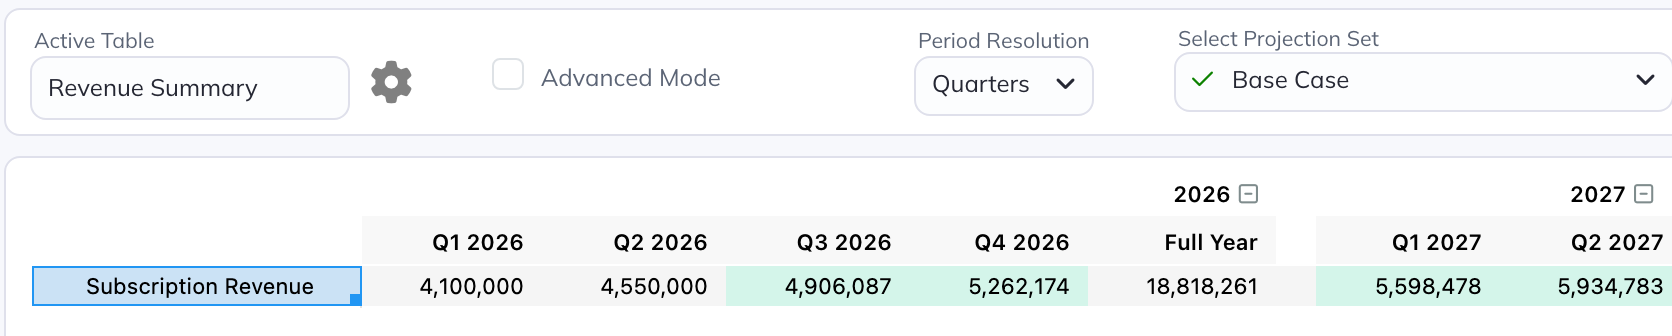
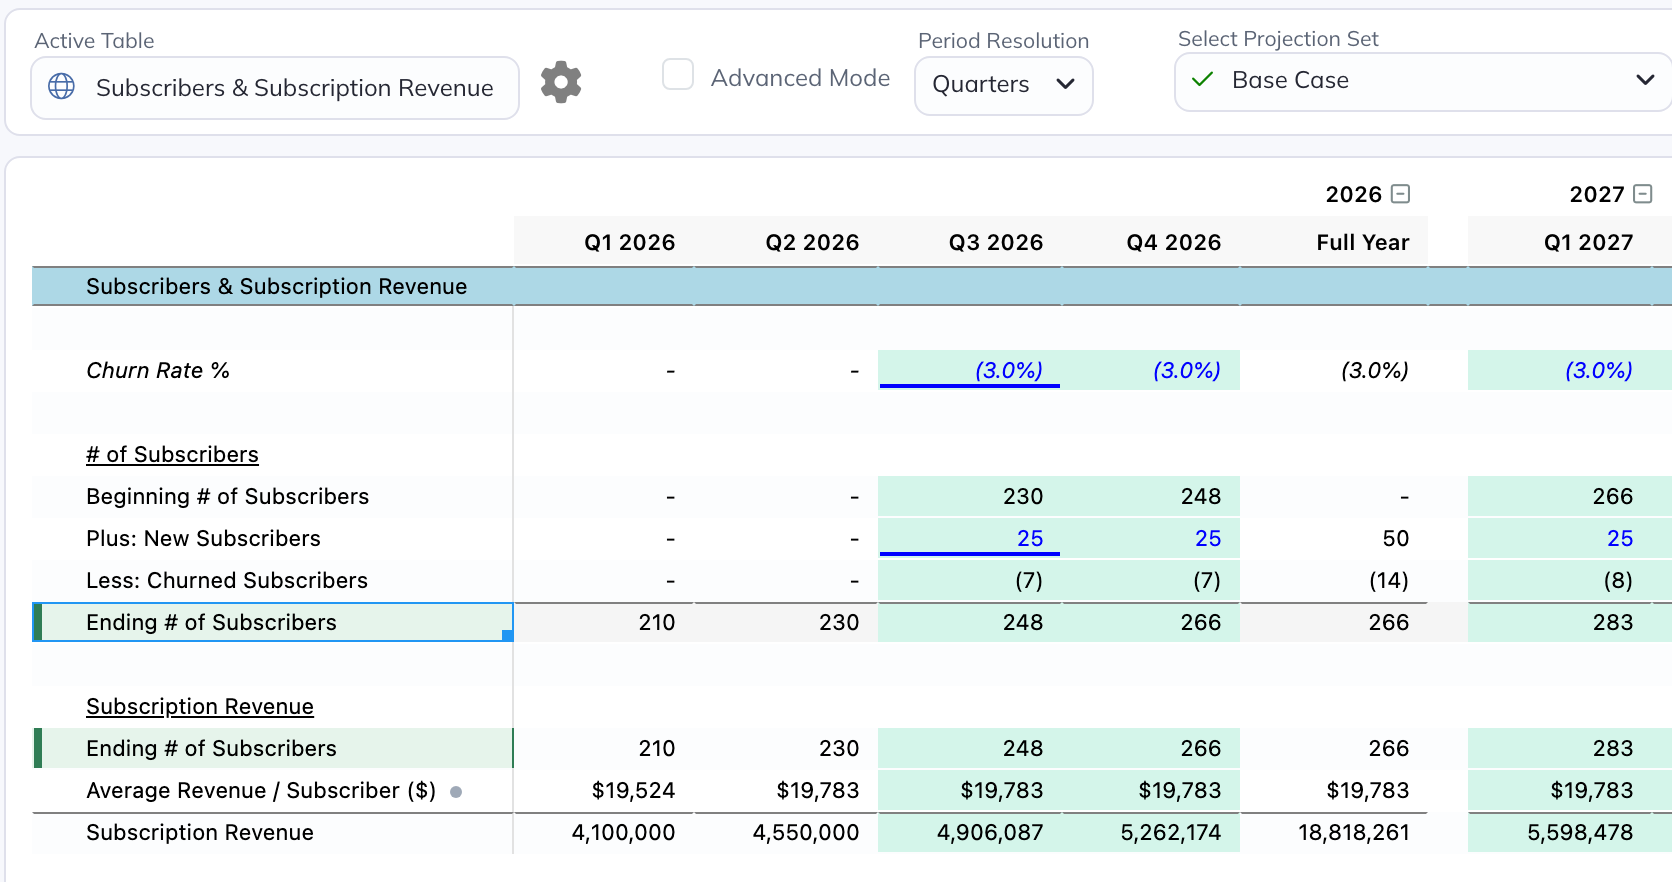
In this example, the first View shows Subscription Revenue with its operating inputs. Revenue Summary displays that same Logic Row after Update Reference. Changing its forecast in either View updates both placements for the selected entity and Projection Set.
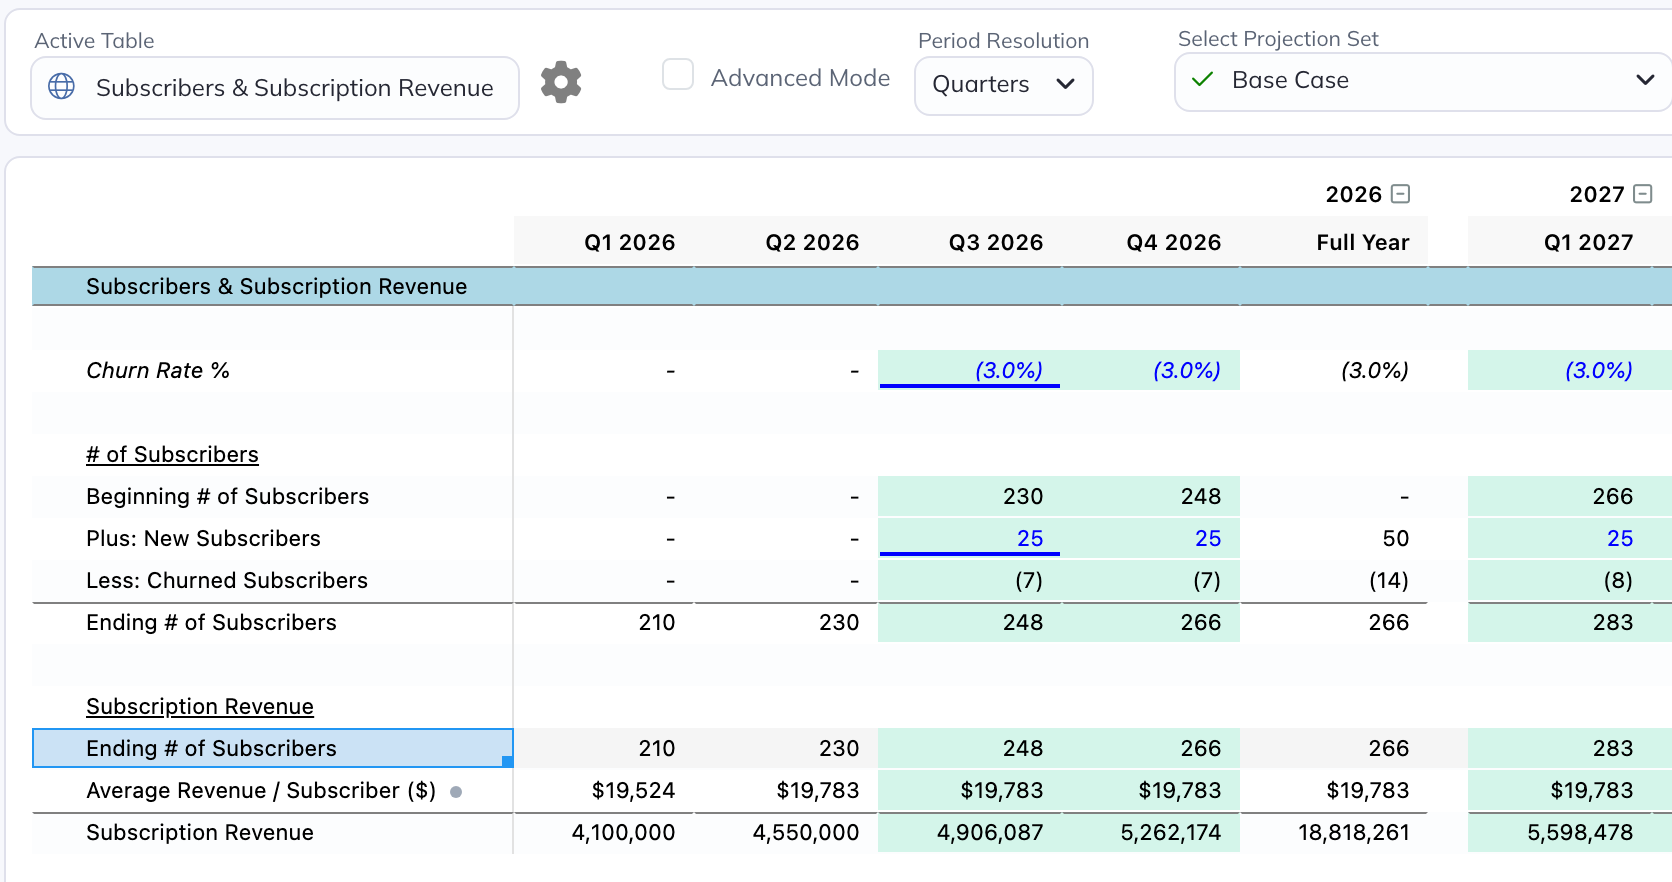
Keep the inputs to a calculation visible in the same View as the calculation. When reusing Revenue, also reuse the rows its formula needs so the build can be followed in either View.
Selecting a Logic Row through a View in the formula picker also references the underlying row. It does not make the formula depend on the placement’s position.
Where Is This Row Used?
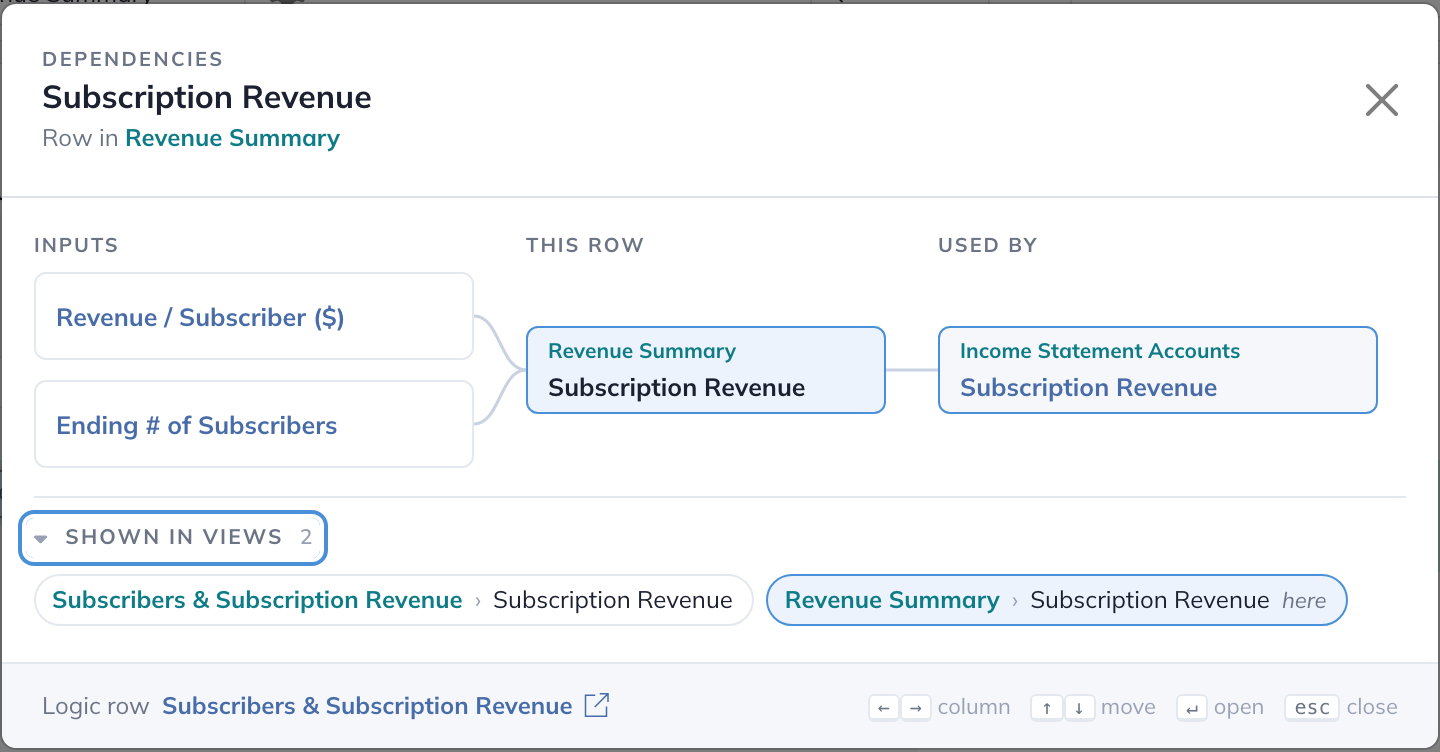
- Click a Logic Row’s label to expand its detail panel, then click See Dependencies, the diagram icon beside Projection Option. In Advanced Mode, it is the icon column between Projection Option and Projection Formula.
- The Dependencies window lists the row’s Inputs and what it is Used by. Shown in views lists every placement; follow a View to inspect the row in context.
- Before deleting, check both Used by and Shown in views. Removing a placement never breaks a formula; deleting the row breaks every formula that uses it.
A row with no placements can still be referenced by formulas. The absence of placements does not mean the row is safe to delete.
When a row has more than one placement, a badge beside Projection Option shows where this placement fits:
| Badge | Meaning |
|---|---|
| 1 of 2 | This View shows the row twice, and this is the first placement. |
| 1 of 1 here, followed by 2 total | This View shows the row once, and another View shows it too. |
Click the position to highlight the row’s placements in this View; click the total to open Shown in views.

Changing a Label in One View
Line Label is the Logic Row’s own name. Changing it updates every View that displays the row. Use Label Alias adds words around that name for this placement only. An alias always includes the row’s name, so it can extend the name but not replace it. It does not change values, formulas, or dependencies.
In the expanded row detail, check Use Label Alias. The editor starts with a chip containing the row’s base label. Keep that chip and type around it: placing “Average ” before a “Revenue / Subscriber ($)” chip produces “Average Revenue / Subscriber ($).” The base-label chip is required. If the base label changes, the alias follows it. For a wholly different name, edit Line Label.
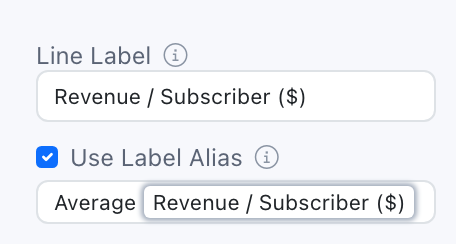
Uncheck Use Label Alias to remove the alias. A small grey dot marks aliased placements. Formula references and the Logic Rows list use the base label; Excel uses each placement’s displayed label.
In Advanced Mode, use the Alias checkbox beside the Label cell. While it is checked, typing in the Label cell edits this placement’s alias. While it is cleared, typing renames the Logic Row in every View. Press Delete on an aliased Label cell to clear the alias, or Escape to cancel an edit in progress.
Aliases are available on Logic Row placements in Standard Views. They are not available on Income Statement, Balance Sheet, or Cash Flow placements, or on List-Scoped Views.
Cloning, Removing & Deleting
| You want | Do this |
|---|---|
| The same calculation in another View | Reuse the row with Update Reference |
| A separate line you can edit independently | Clone the row |
| An alternative scenario for the model | Use another Projection Set |
Cloning
- Clone a row: Creates a separate Logic Row. Editing the clone does not edit the original.
- Clone a View: Copies the View’s lines and clones each distinct Logic Row it displays into a new Logic Row Group. Formulas among those rows point to their clones; references to rows outside the cloned View keep their original targets. Repeated placements of one row still share one cloned row.
Cloning a global View creates a new global View and global Logic Rows across Projection Sets. The app asks you to confirm this scope.
Removing a Placement or Deleting a Row
Expand a placement and open Delete, or right-click the row in Advanced Mode:
- Remove from this view (Advanced Mode: Remove Row from View) removes this placement. The Logic Row, its other placements, and formulas that reference it are kept.
- Delete logic row (all views) (Advanced Mode: Delete Logic Row (all views)) deletes the Logic Row and every placement of it.
Deleting a View
- Delete View Only: Deletes the View and keeps its Logic Rows.
- Delete View + Logic Rows: Also deletes the Logic Rows that no other View displays. Rows shown in another View are kept.
Deleting a Logic Row Group
Deleting a Logic Row Group deletes all of its rows and removes their placements; the confirmation says how many of its rows are still shown in Views. You cannot delete Unassigned or the last Logic Row Group. Deleting a single row from a Logic Row Group is blocked while the row has placements: remove it from those Views first, or delete it from a View with Delete logic row (all views).
When a Formula Loses Its Source
Deleting a row does not stop you when formulas still use it. Each such formula shows #REF! in place of the reference and reports a Critical Error, such as “Formula references a deleted row.” The broken reference counts as zero until you fix it. The red ! in the model header lists these errors; click one to go to the row, then open the formula and replace #REF! with a valid reference.
Check the dependency map before deleting rows, Views with their rows, or Logic Row Groups. Placement counts tell you where a row is displayed; downstream references tell you what depends on it.
Sub-Tables
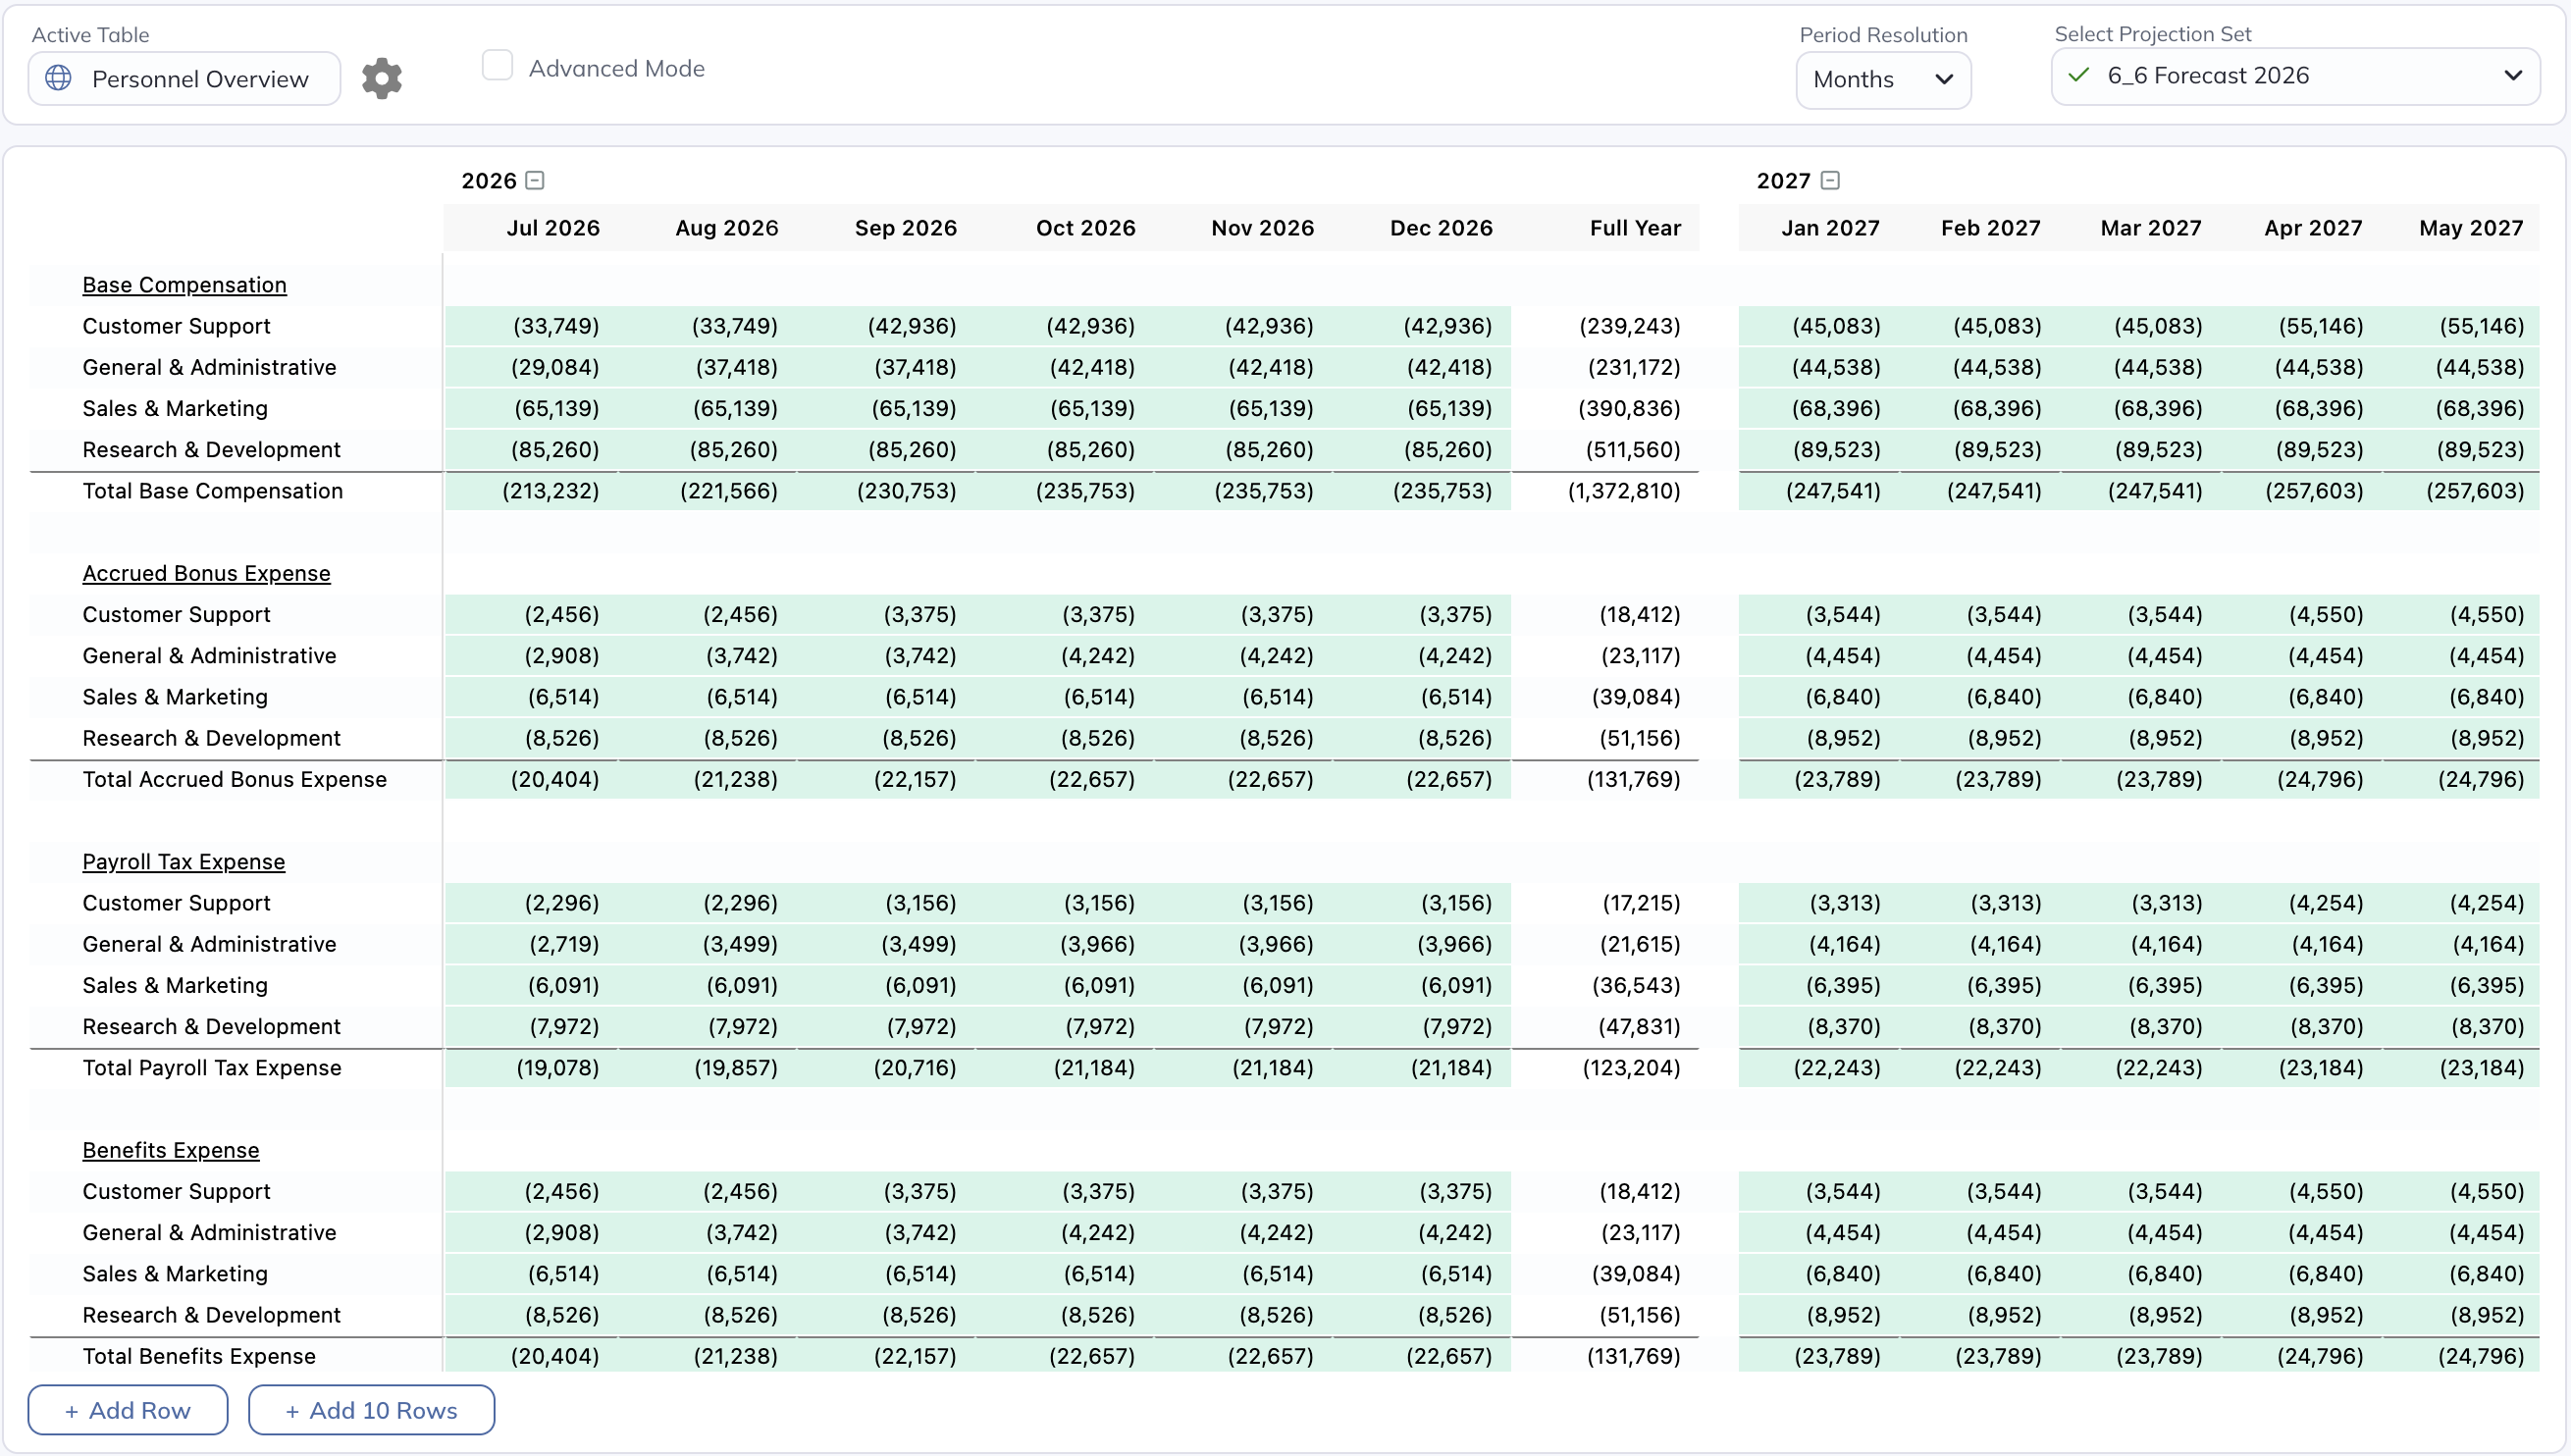
A Sub-Table is a Logic Row whose Row Type is set to Sub-Table. Instead of its own inputs or formula, it shows the rows of a Collection Table inside the View, with optional filters, so you don’t have to add and link each row yourself. It is useful for summary Views. The rows stay in their Collection Table.
- Select + Logic Row, or expand an existing Logic line. In Basic Mode, set Row Type to Sub-Table. In Advanced Mode, set the Type column to Sub-Table.
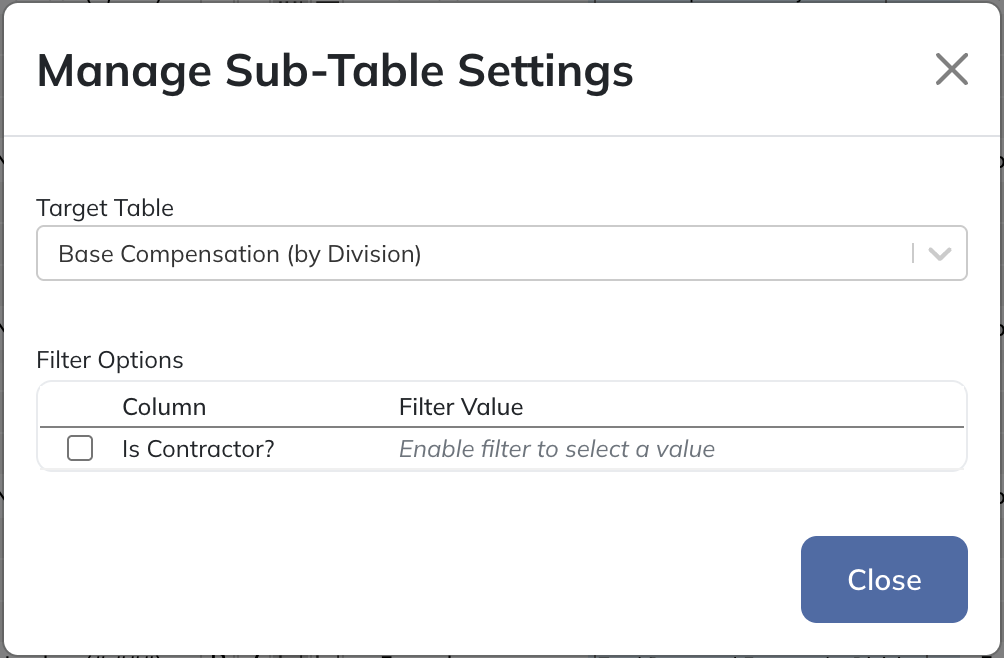
- Click Choose Sub-Table Source… (in Advanced Mode, Settings in the Sub-Table Options column) to open Manage Sub-Table Settings, then choose the Target Table.
- Optionally, enable a filter under Filter Options and choose its Filter Value. Filters use the Target Table’s List and True/False columns. With several filters, a row must match all of them.
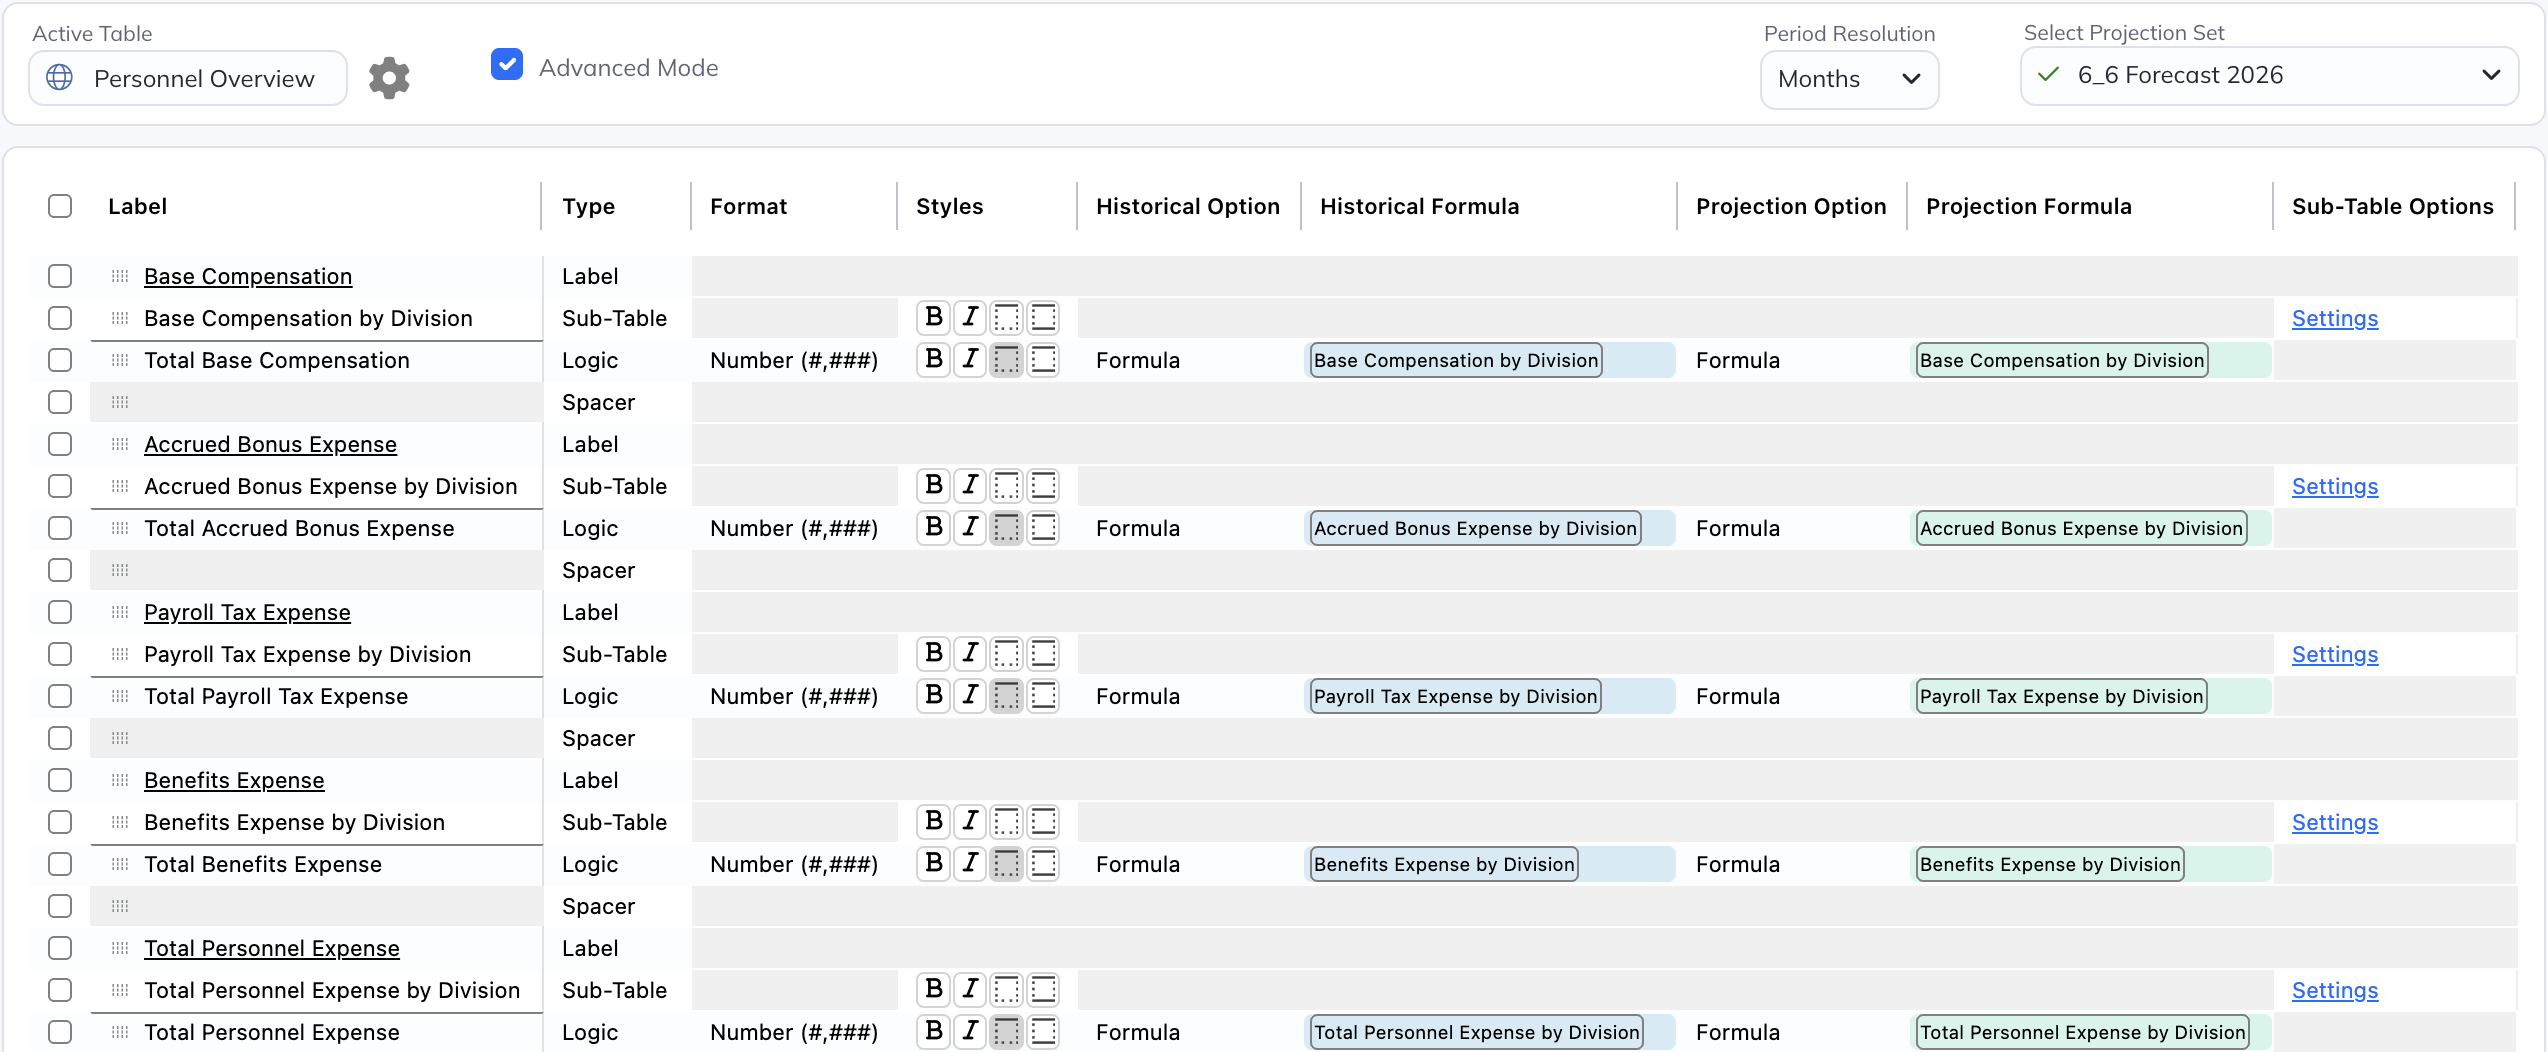
In Basic Mode, a configured Sub-Table displays the Target Table’s rows in the View:
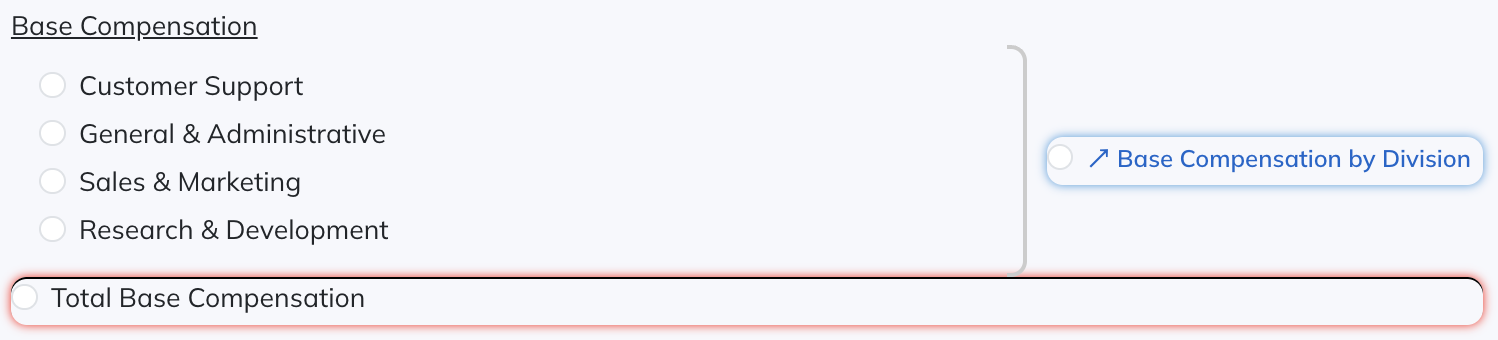
In formulas, you can reference the Sub-Table’s total or any individual row it displays:
Global Tables, Views & Rows
Make a Logic Row, View, or Collection Table global when you need any of these:
- Use in Dashboard, Reports, and Variance.
- Access permissions on the View or table.
- Imported actuals: global Logic Rows and Full global Collection Tables can receive external historical data.
- One structure across scenarios, so the same row or View exists in every Projection Set.
A local object exists only in its own Projection Set. A global object exists across all sets, with some settings shared and others specific to each set. For example, a global Revenue row has the same name and number format in Base Case and Upside Case, while its projection formula and assumptions can differ. Editing the forecast in Base Case leaves the Upside Case forecast unchanged. Renaming the global row changes its name in both.
Table and View global settings require admin access. The row-level Global Row? control follows ordinary Model edit access.
What Is Shared Across Projection Sets?
| Global Object | Shared Across Sets | Can Differ by Set |
|---|---|---|
| Logic Row | Name, number format, history and aggregation settings | Forecast method, formulas, and inputs |
| View | Layout and the Logic Rows displayed | The rows’ forecast values |
| Collection Table (Full) | Item list, columns, and row structure | Forecasts and item inputs |
| Collection Table (Permissions Only) | Name, existence, and access permissions | Item list, settings, and forecasts |
This comparison covers Logic Rows and the Collection Tables you create. Managed financial-statement rows can have system-controlled projection settings shared across sets. List-Scoped Views follow their Reference Table’s global status.
Global Logic Rows
Open a row’s detail and use Global Row? to change its scope. A global row shares its Line Label, number format, Historical Option and formula, Aggregation Option and formula, and any Sub-Table configuration across Projection Sets. A Label Alias changes only a placement’s displayed label; it still includes the underlying row name.
Forecast settings remain specific to each Projection Set: Projection Option, projection formula, hardcoded values, Split by Period entries, trailing-average settings, Dynamic Offsets, and comments.
A global row’s formulas can reference local rows or Collection Tables. Making Revenue global does not make every input in its formula global. Each Projection Set supplies the inputs for its own forecast.
To load external actuals into a global Logic Row, choose External Data as its Historical Option and map a data connection to it.
Global Views
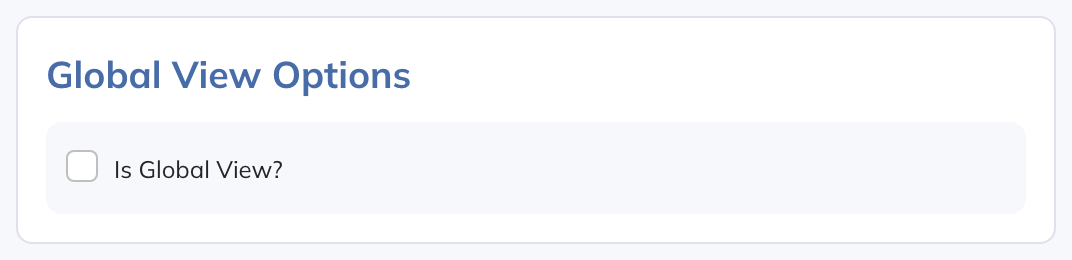
Use Is Global View? in the View’s settings to share its layout across Projection Sets. Turning it on or off also changes the scope of the rows and tables it displays; see What Changes Together below. Review the confirmation, which lists how many rows and tables will change scope.
Users without permission to access a restricted global View cannot open it on the Model tab or reporting pages.
Global Collection Tables
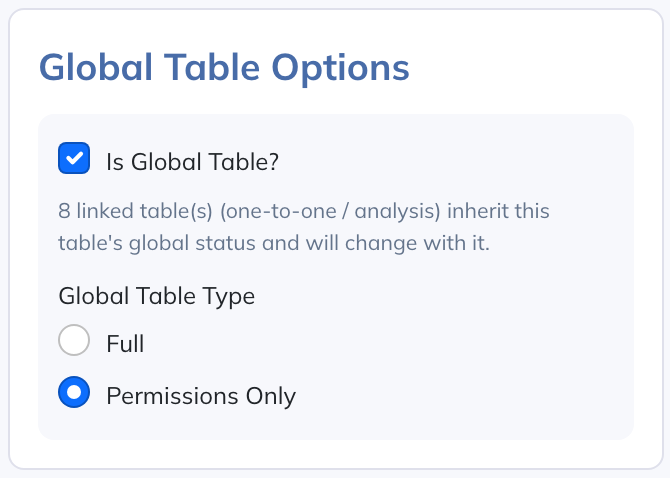
On a Standard Collection Table, enable Is Global Table? and choose a Global Table Type:
- Full: Shares the item list and row structure across Projection Sets. Forecasts and item inputs can differ by set. The table can receive historical data and be used on reporting pages.
- Permissions Only: Shares the table’s name and access permissions, while each Projection Set keeps its own items, settings, and inputs. This is useful for a personnel table with restricted access and a different hiring plan in each scenario.
What Changes Together
Changing the scope of one object can change others:
| When You | This Also Happens | To Reverse It |
|---|---|---|
| Turn on Is Global View? | Every Logic Row the View displays becomes global, and so do the Collection Tables those rows expand as Sub-Tables. | Turn it off. The View becomes local to the current Projection Set. Its rows become local unless another global View displays them, and Sub-Table sources become local unless another global row or table still requires them. |
| Display a row in a global View | The row must stay global, so its Global Row? checkbox is locked. | Remove the row from every global View that displays it, or make those Views local. |
| Make a Sub-Table Logic Row global | Its source tables become global, after confirmation. | Making the row local leaves the source tables global. Change them in their own Table Settings. |
| Change a source table’s global setting | Related tables follow it: One-to-One tables follow their parent, Analysis tables the table they analyze, and Multi-Entity Combination tables their first member table. | Change the setting on the source table. |